Inference for a single mean
Chapter 19
Inference with numerical variables
Which of the following scenarios involves a mean? Which involves a proportion?
- Researchers want to know whether more Oregonians than Californians report being sleep-deprived.
- A city council member wants to know how likely it is that a proposed tax bill passes in an upcoming election.
- Scientists want to know the typical amount of mercury contained in the muscle tissue of dolphins.
- Researchers conduct a study to examine the effects of coffee consumption on depression.
Dolphins
Mercury is a heavy metal that lasts a long time in the bodies of animals that consume it; ingesting too much can be harmful.
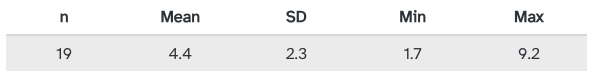
Scientists want to predict the typical amount of mercury contained in the muscle tissue of dolphins from the Taiji area of Japan, so they sample 19 dolphins for mercury content (\(\mu\) g/wet g).
![]()
Dolphins: confidence interval
The mean (average) amount of mercury in our sample is \(4.4\) g/ wet g. What can this tell us about the population parameter?
We want to find a confidence interval for the average amount of mercury in the entire population of local dolphins (\(\mu\))
Previously… \[
\mbox{CI} = \mbox{point estimate} \pm z^\ast * SE
\] where \(z^*\) was determined using our normal distribution based on our particular confidence level (eg, 95%).
EXCEPT we now have two problems:
- We don’t know the population standard deviation, \(\sigma\), which is needed for calculating SE
- Although we can use the sample standard deviation \(s\) as an approximation, this is less accurate and so we will no longer have a normal distribution – especially if sample size is not very large.
A new model: t-distribution
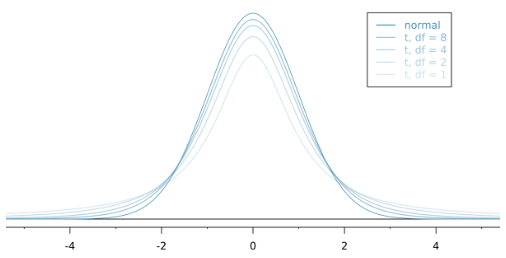
Because the sample standard deviation can vary a lot between samples, we have a t-distribution curve rather than a normal curve.
![]()
Exact shape depends on sample size via degrees of freedom: \(\mbox{df} = n-1\).
Back to Confidence Intervals
\[
\mbox{CI} = \mbox{point estimate} \pm t_{df}^\ast * SE
\] where \(t^*\) is determined based on our particular confidence level (eg, 95%) and degree of freedom
\[
SE = \frac{ s}{\sqrt{n}}
\]
Example
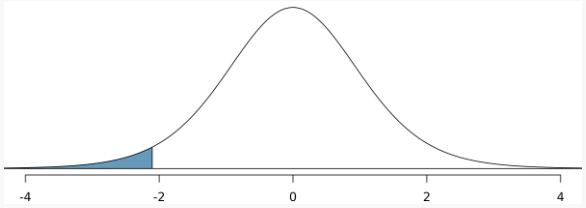
When \(n=19\), what is \(t^\ast_{df}\) for a 95% confidence interval?
Question: where did 0.975 come from?
- Use Desmos to find \(t^\ast_{18}\)
Example
Compute and interpret the 95% confidence interval for the average mercury content in Risso’s dolphins.
\[\begin{align}
\bar{x} &\pm t^\ast_{18} \times SE \\
4.4 &\pm 2.10 \times 0.528 \\
&(3.29, 5.51)
\end{align}\]