chi-squared tests with technology

Chapter 18

Last time…

In response to buyer’s prompt, seller either discloses the known issue or does not.

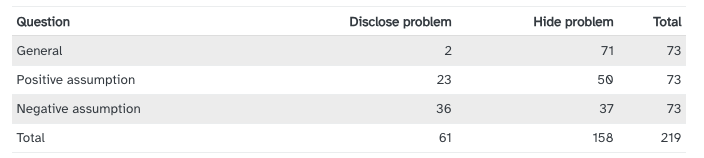
Is the buyer’s question independent of whether the seller disclosed the problem?

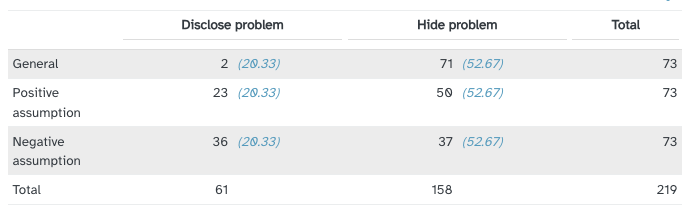
We found expected counts for each group…

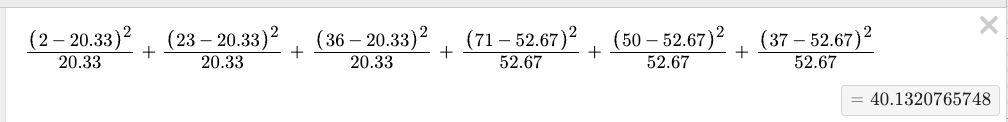
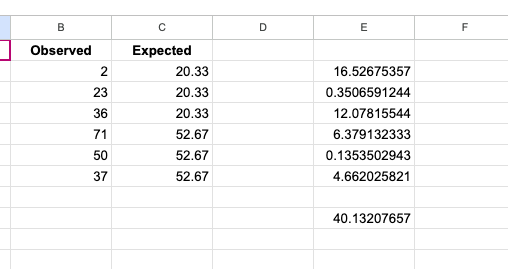
Then calculated \(\chi^2\)

\[ \chi^2 = \sum\frac{( O - E)^2}{E} \]

Chi-squared

\[\begin{multline} \chi^2 = \frac{(2 - 20.33)^2}{20.33} + \frac{(23-20.33)^2}{20.33} + \\ \frac{(36-20.33)^2}{20.33} + \frac{(71 -52.67)^2}{52.67} + \\ \frac{(50-52.67)^2}{52.67} + \frac{(37-52.67)^2}{52.67} \\ = 40.13 \end{multline}\]

How can we make this calculation easier?

Option 1: Desmos

Link to Desmos Example

Option 2: Spreadsheet

Link to Google Sheets

Option 3: simple R

Make a two-way table

observed <- c(2, 23, 36, 71, 50, 37)

two_way <- matrix(observed, 3, 2)

two_way
     [,1] [,2]
[1,]    2   71
[2,]   23   50
[3,]   36   37

Chi-squared test

chisq.test(two_way)

    Pearson's Chi-squared test

data:  two_way
X-squared = 40.128, df = 2, p-value = 1.933e-09

Larger datasets

For larger datasets, it’s not practical to enter numbers by hand!

Example

An experiment was run to evaluate three treatments for Type 2 Diabetes in patients aged 10-17 who were being treated with metformin. The three treatments considered were continued treatment with metformin (met), treatment with metformin combined with rosiglitazone (rosi), or a lifestyle intervention program. Each patient had a primary outcome, which was either lacked glycemic control (failure) or did not lack that control (success).

two-way (contingency) table

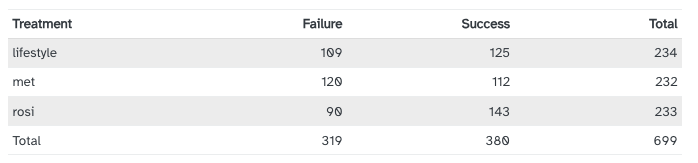
\(H_0\): treatment and outcome are independent

\(H_A\): there is a difference in outcomes between the treatments

Load dataset

library(openintro)
print(diabetes2)
# A tibble: 699 × 2
   treatment outcome
 * <fct>     <fct>  
 1 met       success
 2 rosi      failure
 3 rosi      success
 4 lifestyle success
 5 met       success
 6 lifestyle success
 7 lifestyle success
 8 rosi      success
 9 rosi      success
10 met       failure
# ℹ 689 more rows

Option 4

cont_table <- table(diabetes2$treatment, diabetes2$outcome)
           
            failure success
  lifestyle     109     125
  met           120     112
  rosi           90     143


chisq.test(cont_table)

    Pearson's Chi-squared test

data:  cont_table
X-squared = 8.1645, df = 2, p-value = 0.01687

Option 5: use infer package

library(infer)

chisq_test(diabetes2, treatment ~ outcome)
# A tibble: 1 × 3
  statistic chisq_df p_value
      <dbl>    <int>   <dbl>
1      8.16        2  0.0169