Inference for Single Proportion - part 2
Chapter 16
Medical consultant example…
A consultant tried to attract patients by noting the average complication rate for liver donor surgeries in the US is about 10%, but her clients have had only 3 complications in the 62 liver donor surgeries she has facilitated. She claims this is strong evidence that her work meaningfully contributes to reducing complications (and therefore she should be hired!).
\[ \hat{p} = \frac{3}{62} = 0.048 \]
State the null hypothesis
Claim is that \(\hat{p}\) is less than then national average of 0.1
- \(H_0: p = 0.1\)
- \(H_A: p < 0.1\)
Discernment level?
Type I error: mistakenly reject \(H_0\) when it’s true
- Misled by false advertising!
- Make \(\alpha\) smaller to avoid
Type II error: mistakenly fail to reject \(H_0\) when it’s false
- Being cautious leads to missing out on above average care.
- Make \(\alpha\) larger to avoid
Check conditions for CLT
Independent? yes
Large enough sample size? no!
\(n p_0 = 62 \cdot 0.1 = 6.2\)
\(n (1-p_0) = 62 \cdot 0.9 = 55.8\)
What happens if we ignore this?
Calculate Z
\[ SE = \sqrt{ \frac{p_0 (1-p_0)}{n}} = \sqrt{\frac{0.1 \cdot 0.9}{62}} = 0.038 \] \[ Z = \frac{\hat{p} - p_0}{SE} = \frac{ 0.048 - 0.1}{0.038} = -1.37 \]
Find p-value for Z = -1.37

Compare to discernment level
Suppose \(\alpha = 0.1\) (trying to avoid Type II errors)
Since p-value (0.085) is less than \(\alpha\), we do have evidence to reject the null hypothesis.
We think that our consultant’s complication rate is significantly below the national average.
BUT WAIT!
CLT isn’t valid!!
Do a simulation!!
Simulated Null-Distribution
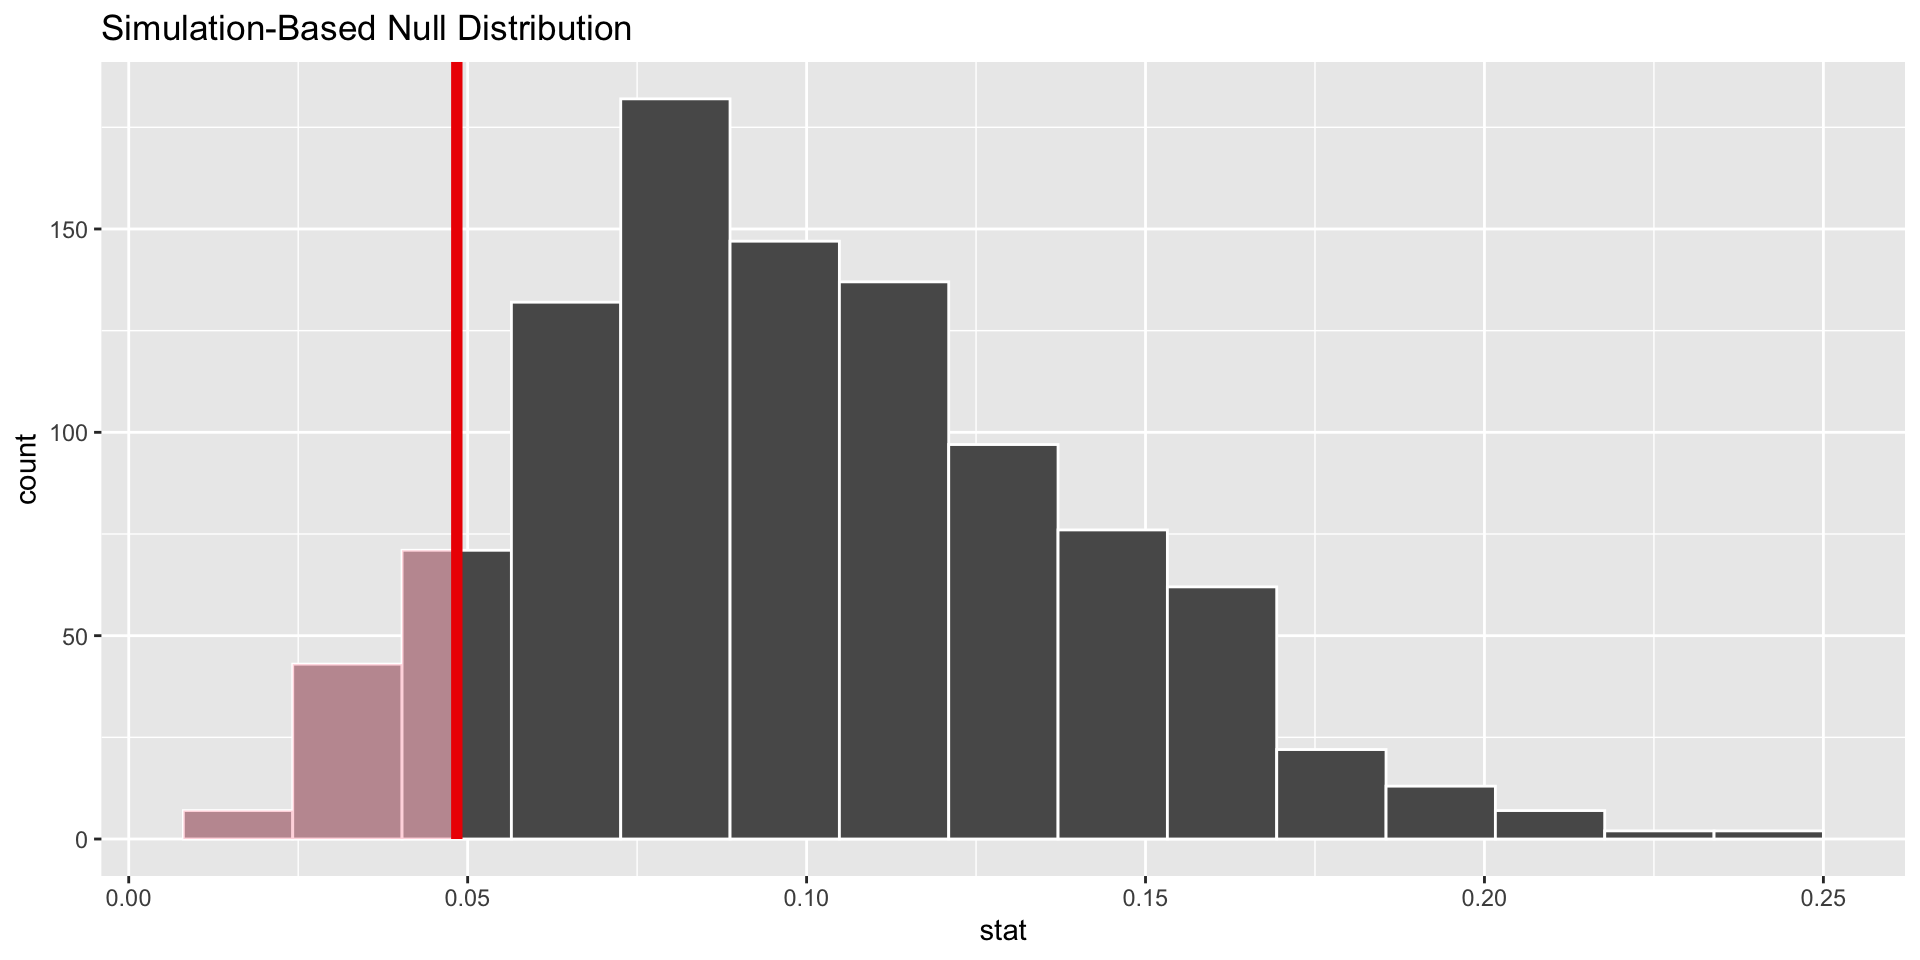
Actual p-value?
# A tibble: 1 × 1
  p_value
    <dbl>
1   0.121
- Not less than \(\alpha = 0.1\)
- Previously had found \(p = 0.085\)
- conclusion depends on discernment level as well as how we found p-value