Normal Distrubtion (continued)
Chapter 13
from Tuesday…
Central Limit Theorem
The distribution of the sample statistic is normal if certain conditions are met.
- What do we mean by the distribution of the sample statistic?
- What conditions need to be met?
Sample distribution
Example: In a sample of 224 ring-tailed lemurs, the average weight was 924 grams.
We expect the sample statistic to approximate the population parameter
But if you looked at a different sample you would not expect to get the same number!
Sample distribution
- take another sample of size \(n\) (original sample size) from the population
- calculate and record the sample statistic for this new sample
- repeat this hundreds (thousands?) of times
- not at all practical!
Instead…
Either use simulation (randomization, bootstrapping, etc!)
Or use mathematical theory to know what to expect if we had taken repeated samples (central limit theorem)
Conditions required by CLT
- Independent observations
- Guaranteed when we take a random sample.
- Large enough sample
What qualifies as “large enough” differs by context (i.e., from sample statistic to sample statistic).
E.g. for proportions, need at least 10 expected successes and 10 expected failures.
Use the normal distribution…
To make decisions – hypothesis testing
- determine the probability of the observed sample statistic (or something more extreme, in the direction of the alternative hypothesis), i.e. the p-value
Use the normal distribution…
To make estimations – confidence intervals
- calculate the bounds of the confidence interval, adding and subtracting a margin of error to the observed sample statistic
Empirical Rule
The normal distribution is not just any unimodal and symmetric distribution, it follows the 68-95-99.7 rule.
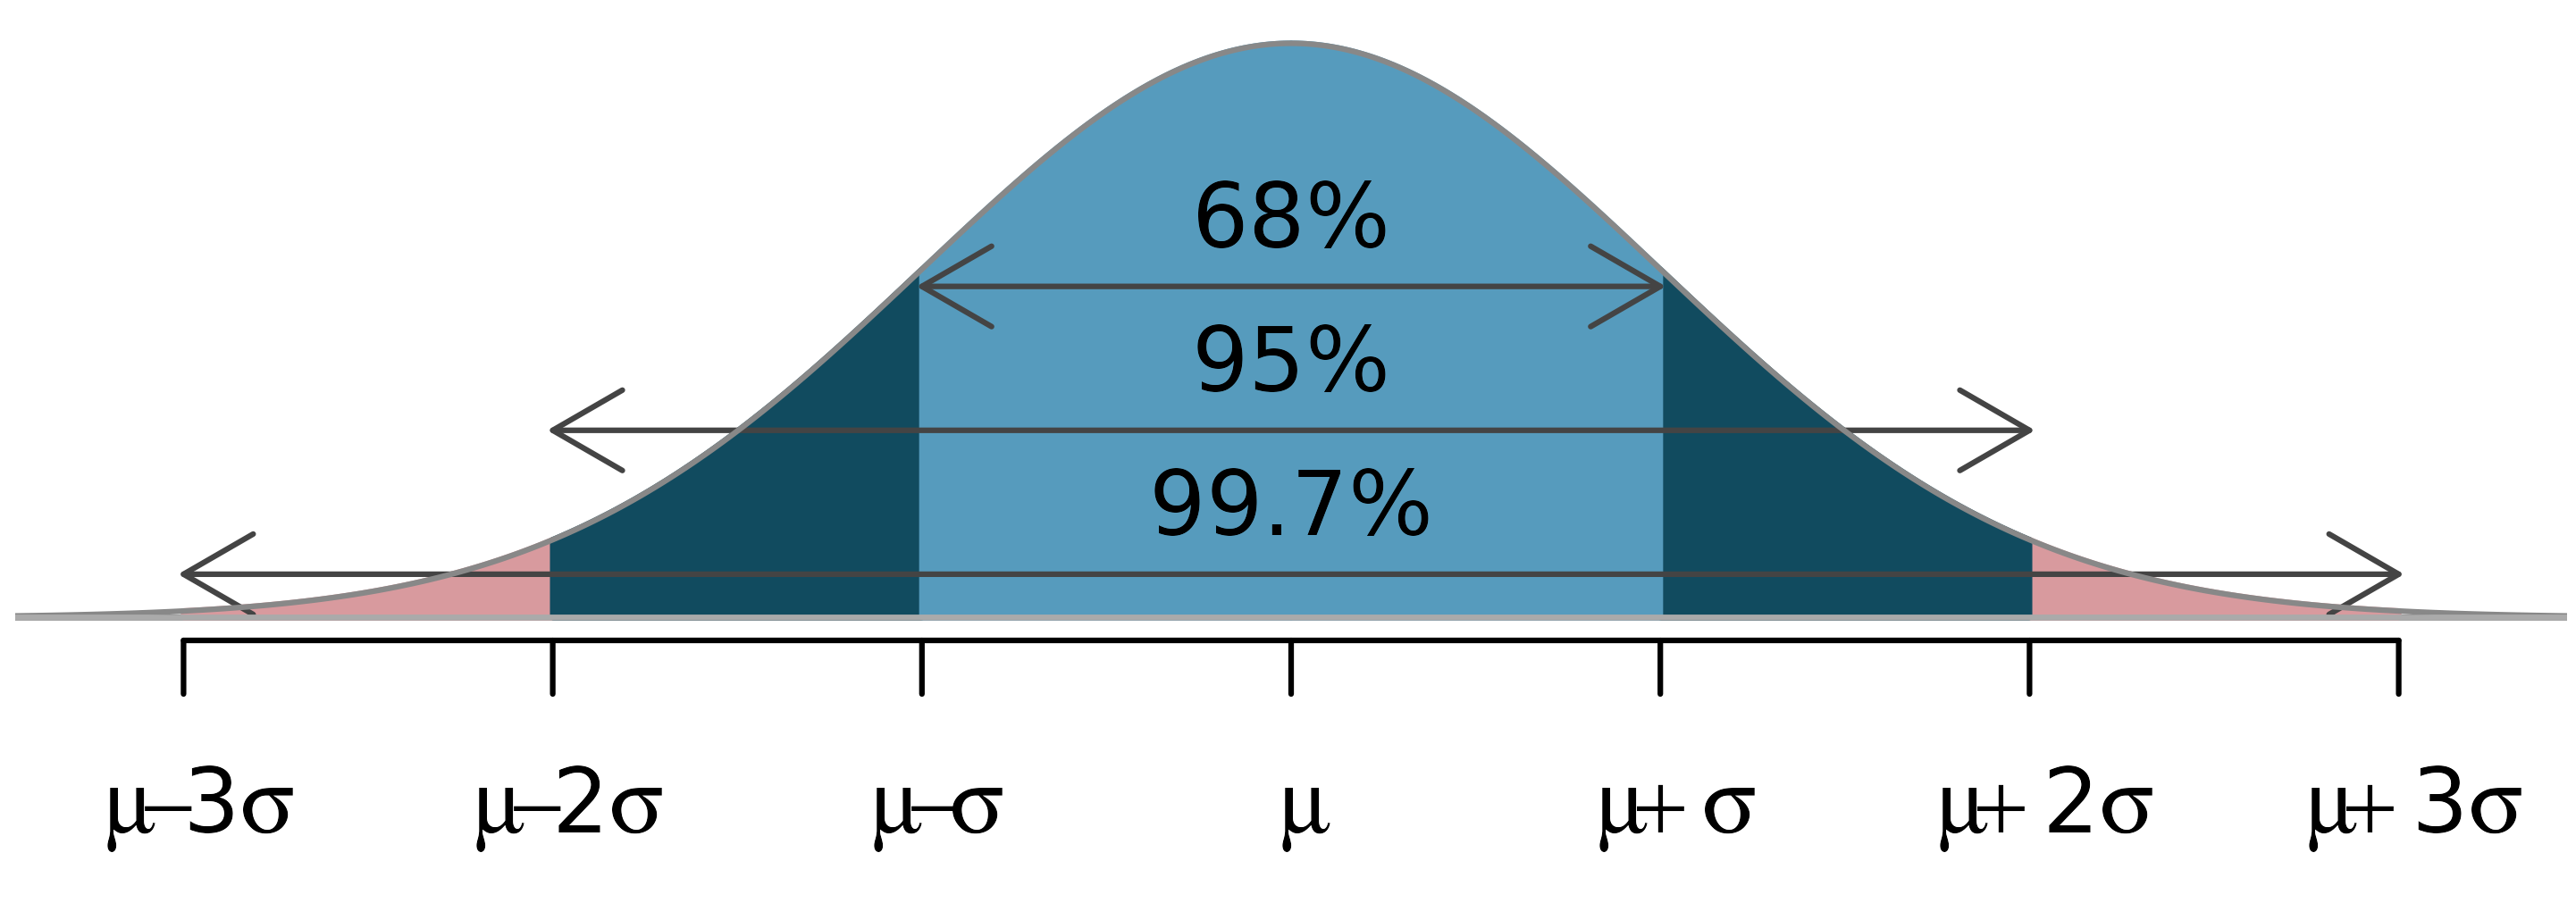
The mean height of female identifying adults in the U.S. is 64.5’’ with a standard deviation of 2.5’’.
Based on the empirical rule, about 95% of the adult female population is in what range of heights?
Standard Error
The center of the sampling distribution will be at the true population parameter.
The spread of the sampling distribution is measured by the standard error (like the spread of a single sample is measured by the standard deviation)
Standard Error Formulas
Each sample statistic has own formula for standard error
- \(\bar{x}\) – sample mean
- \(\hat{p}\) – sample proportion
- \(\bar{x}_1 - \bar{x}_2\) – difference of sample means
- \(\hat{p}_1 - \hat{p}_2\) – difference of sample proportions
We’ll see these in later chapters…
Margin of Error
- Measures how far away observations are from population parameter.
- Closely related to standard error: e.g. 95% of observations are within 2 SE of the mean.