Inference with mathematical models
Chapter 13
Describe the shape …
Lemurs mean weight sampling distribution (AE 07)
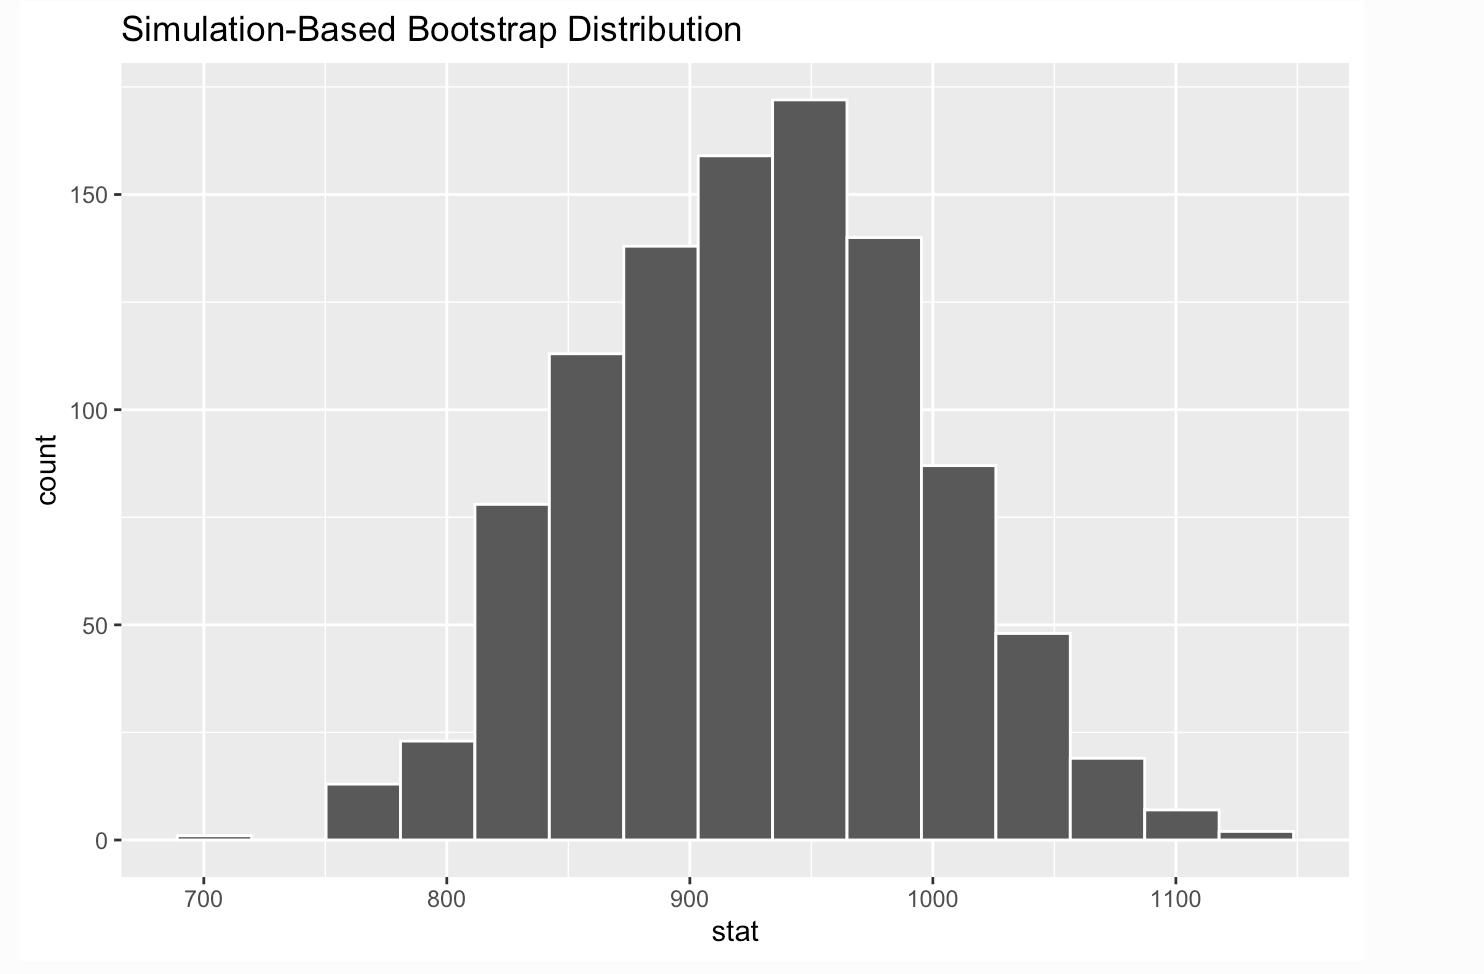
Describe the shape …
Transplant sampling distribution (Ch. 12)
![]()
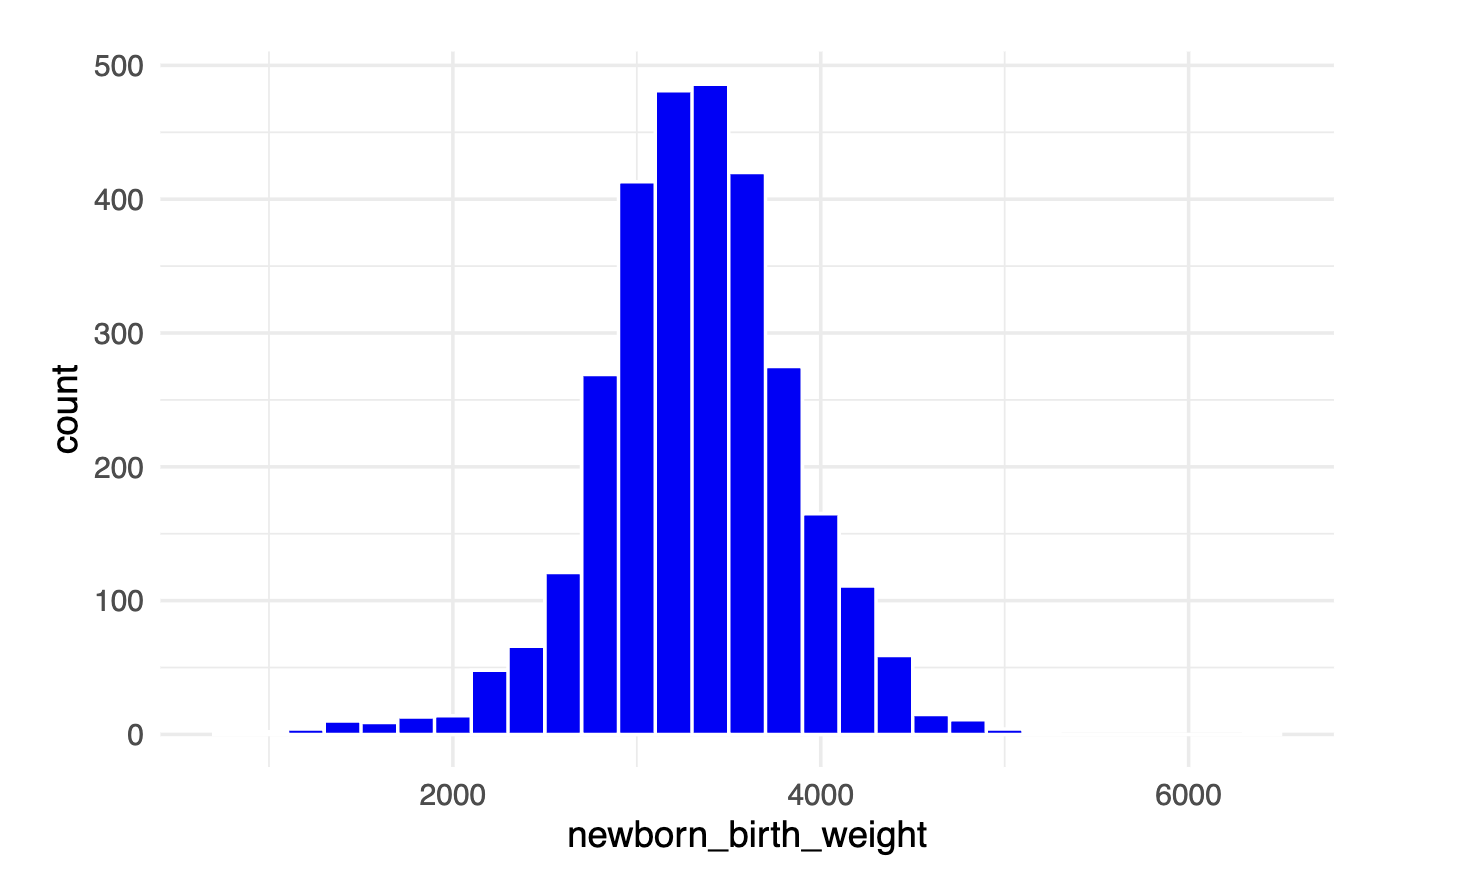
Describe the shape …
newborn birth weight
Normal distribution
- aka bell curve or Gaussian curve
- “normal” has a specific, technical meaning
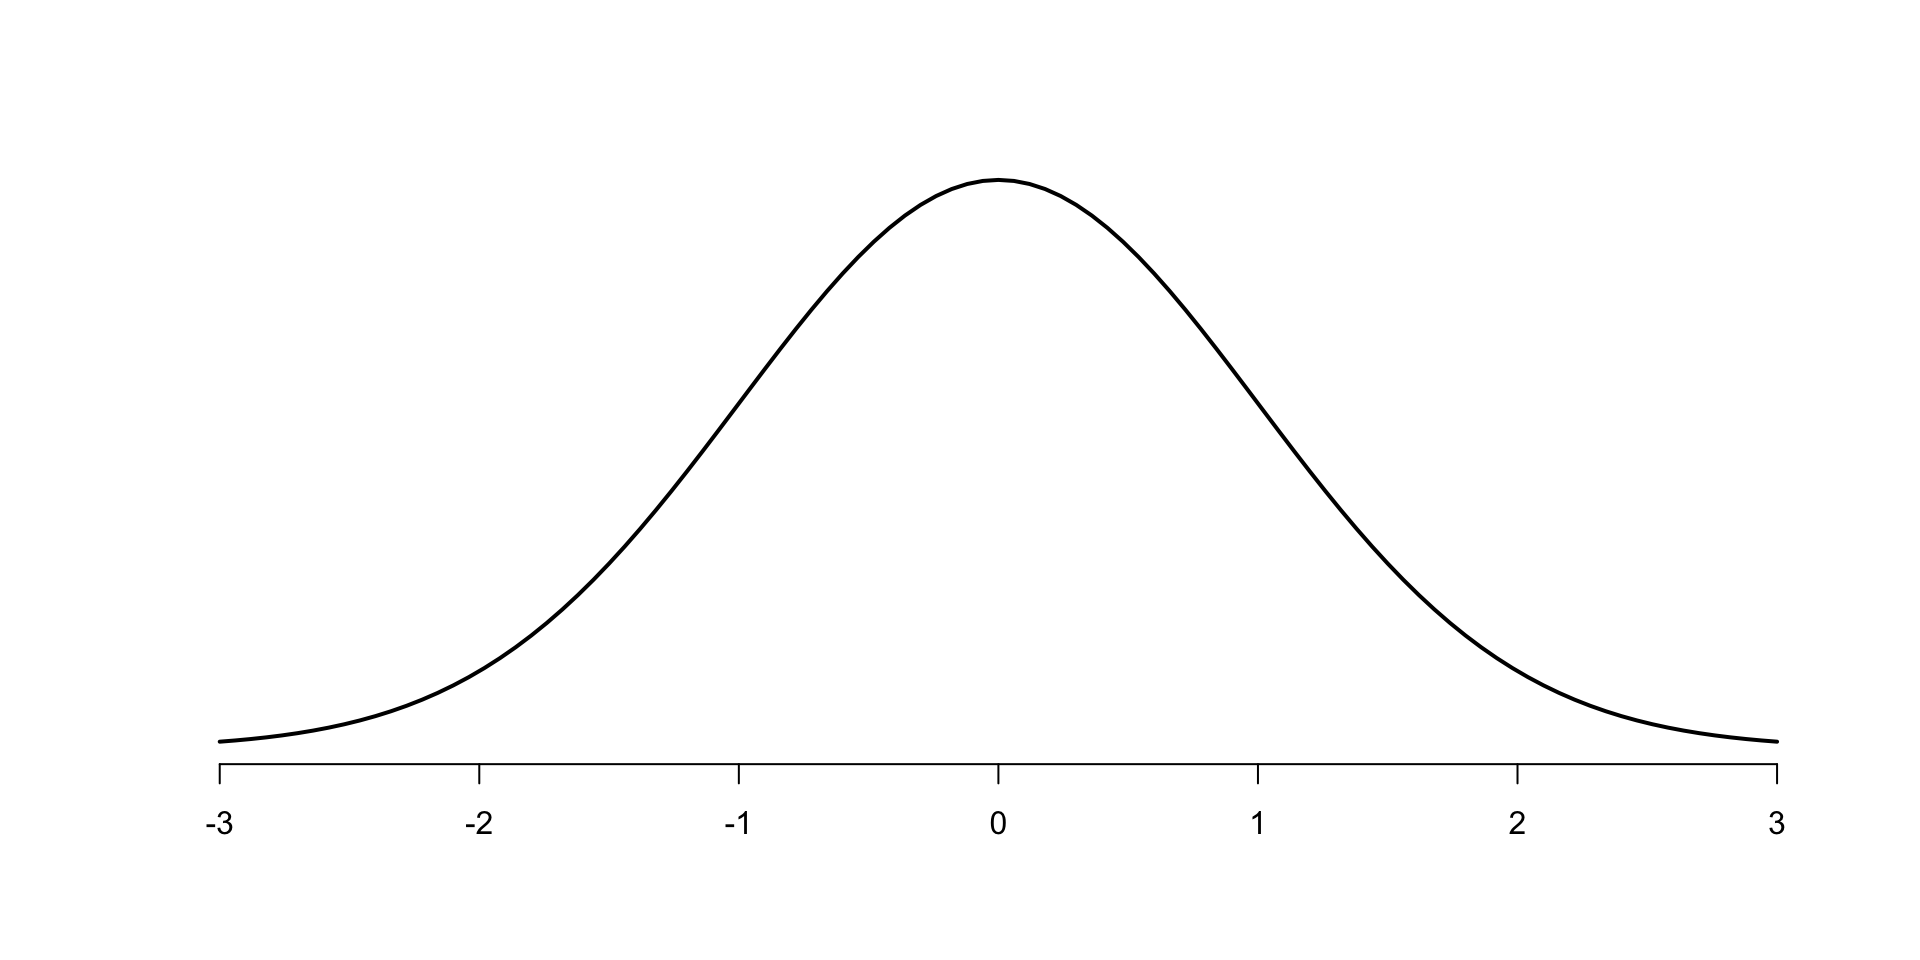
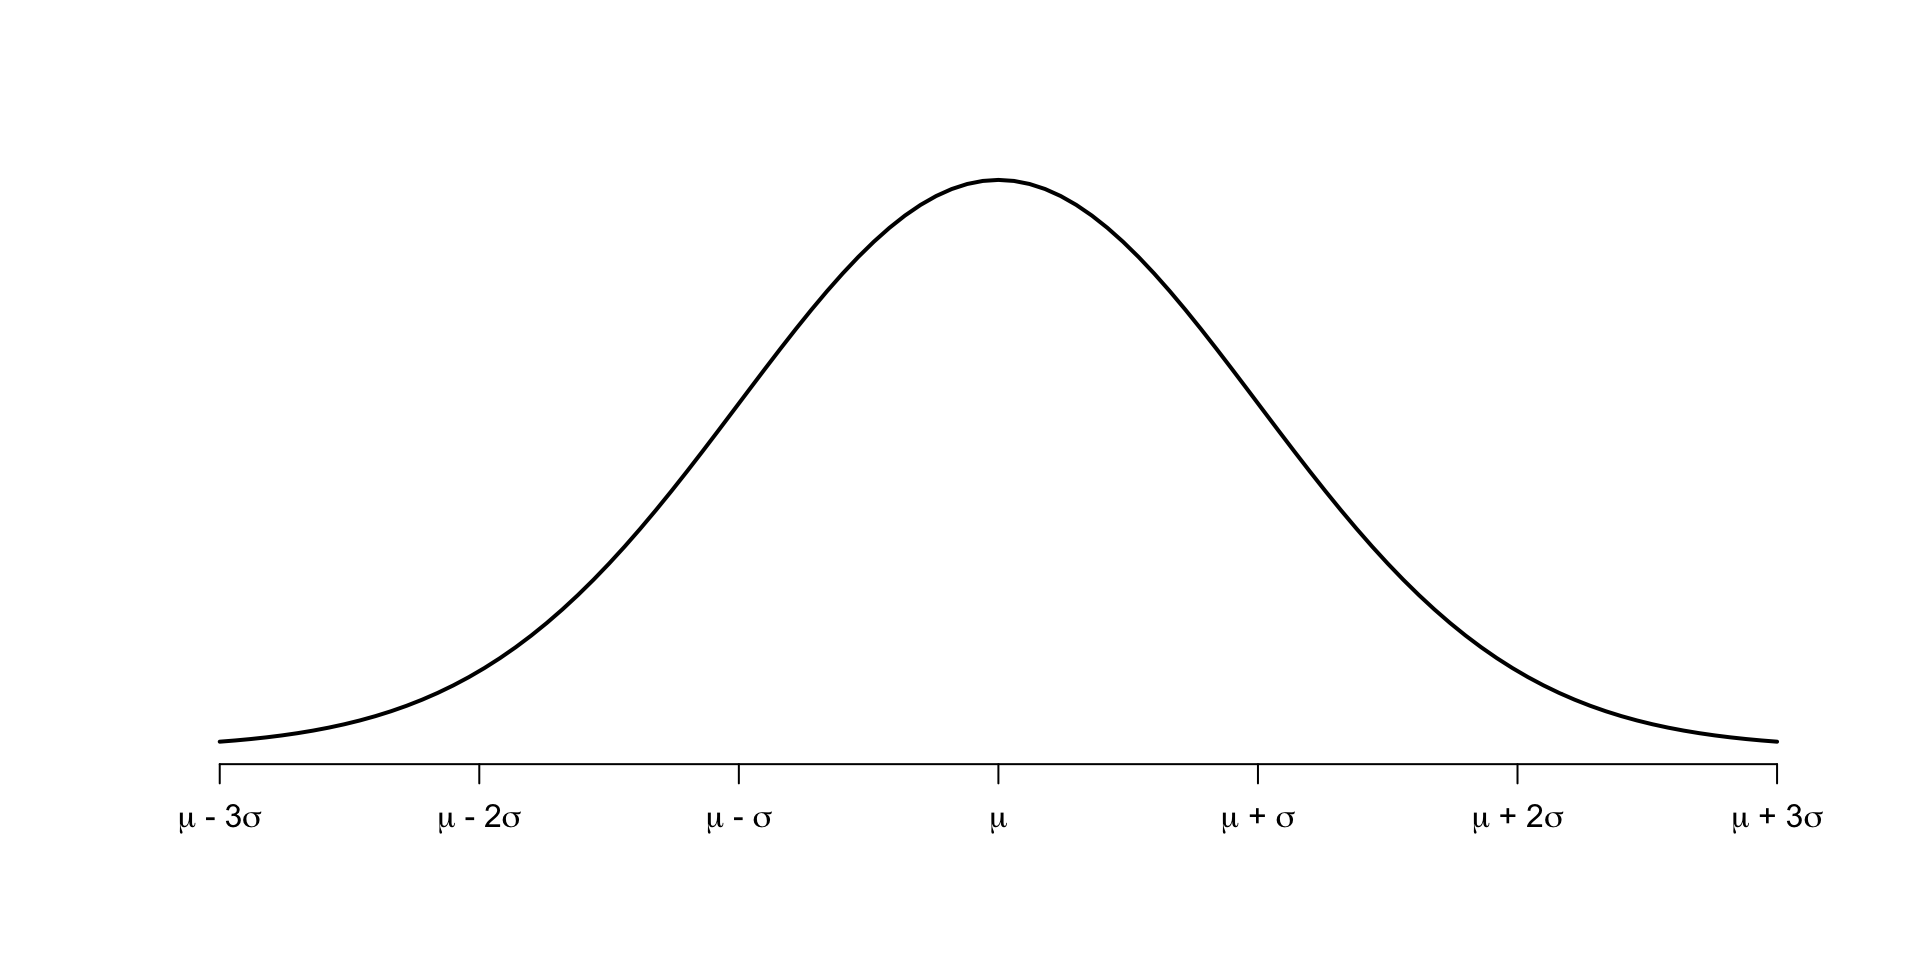
Normal distribution N(\(\mu\), \(\sigma\))
- centered at mean (\(\mu\))
- width characterized by standard deviation (\(\sigma\))
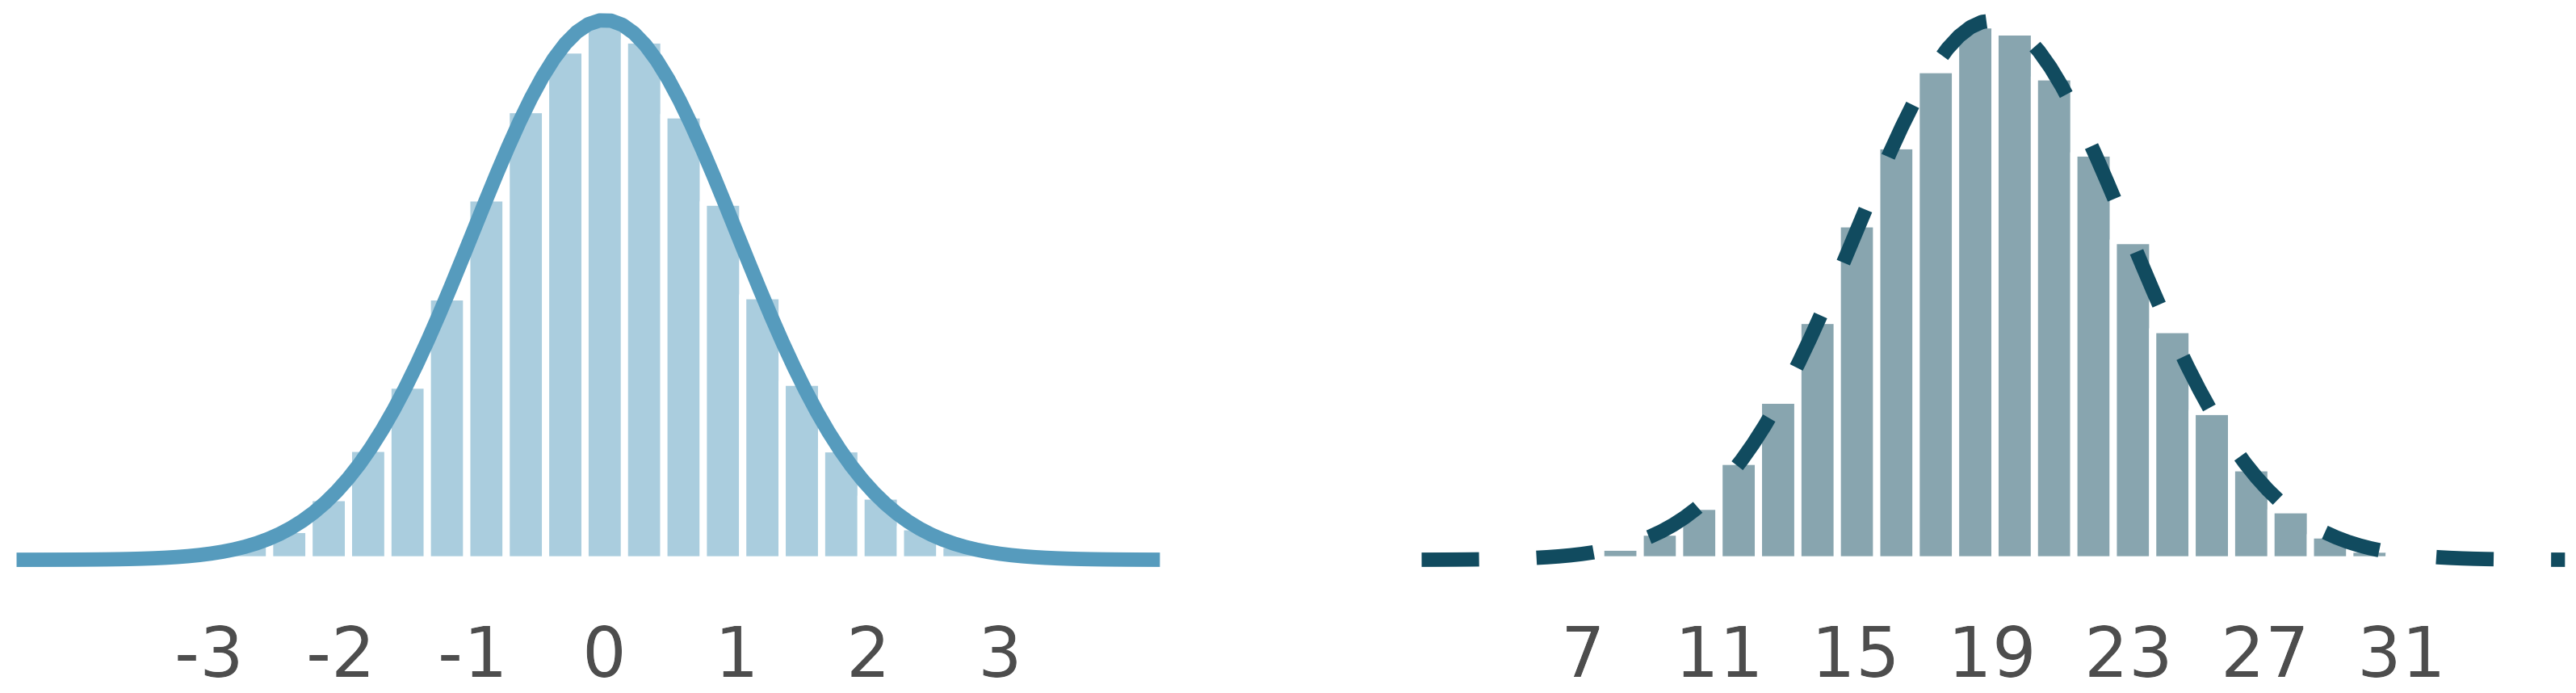
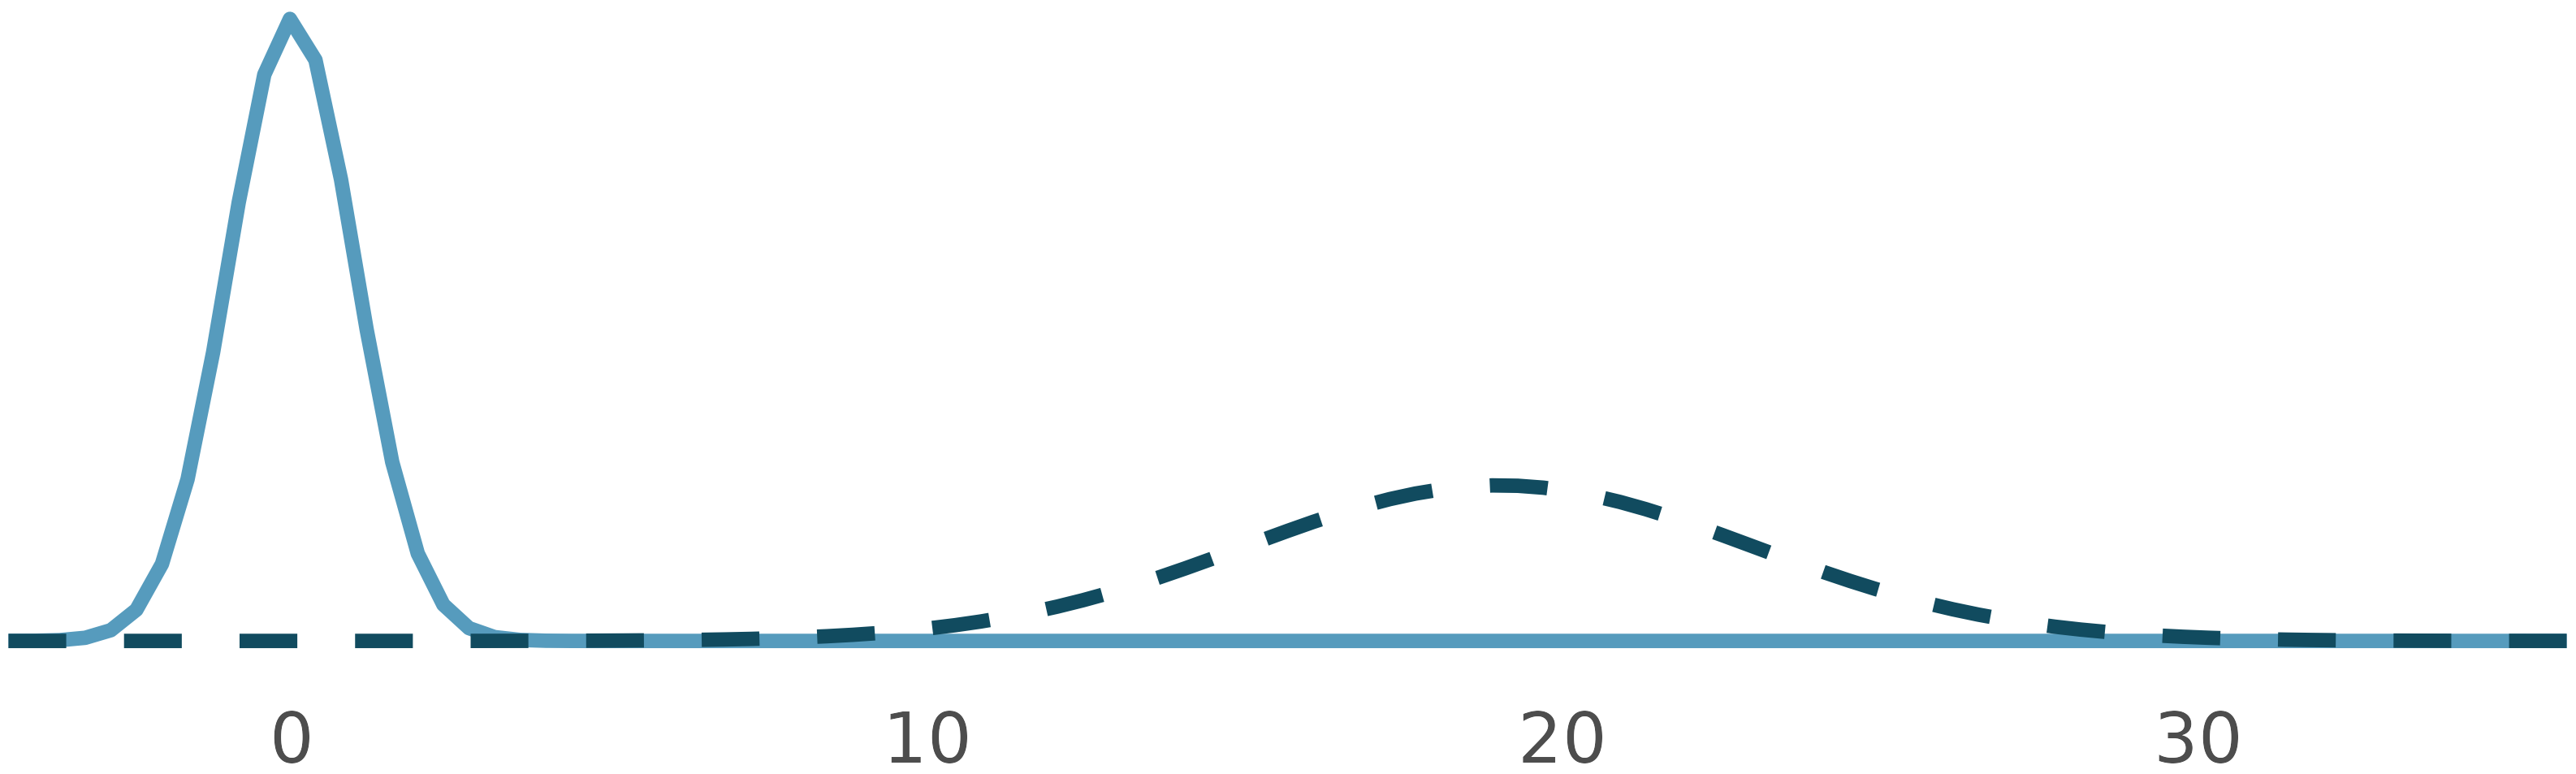
Normal distributions
How are these normal distributions similar? How are they different? Which one is \(N(\mu = 0, \sigma = 1)\) and which \(N(\mu = 19, \sigma = 4)\)?
Compare Graphs
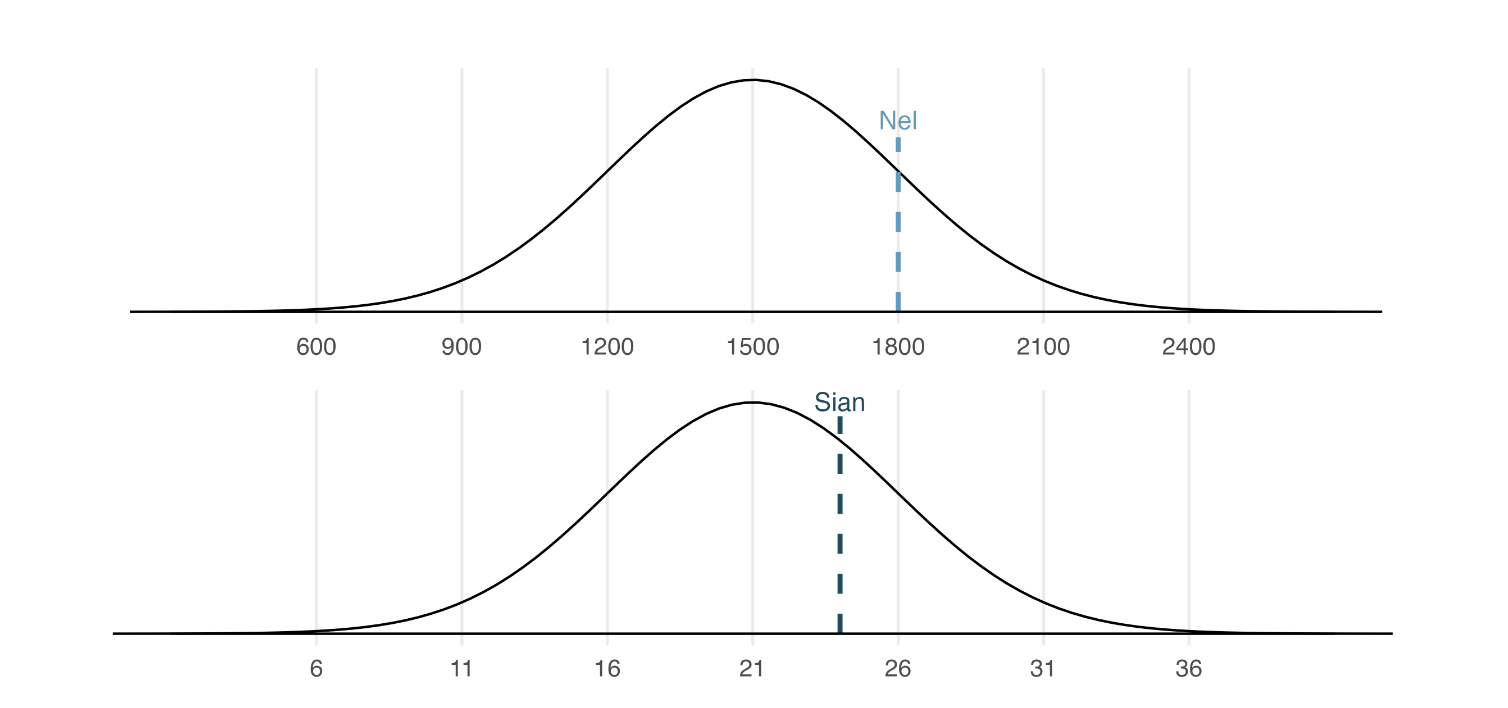
- Nel is 1 sd from mean
- Sian is less than 1 sd from mean
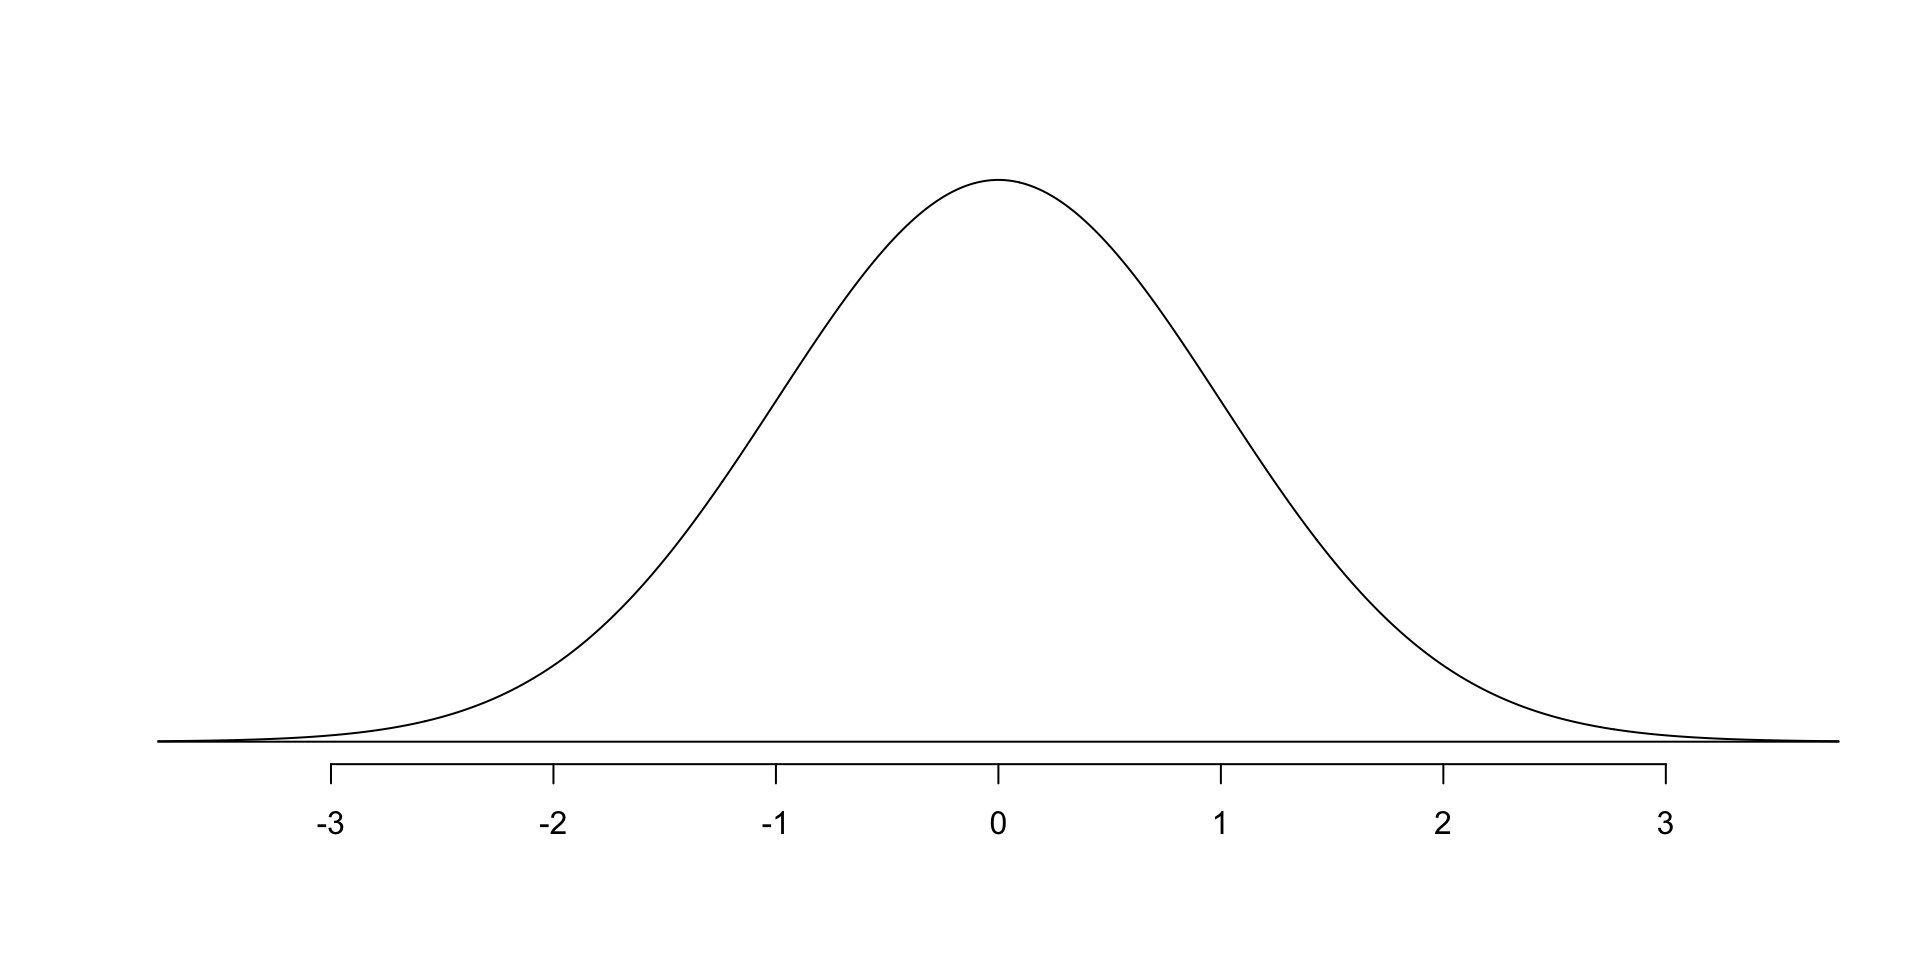
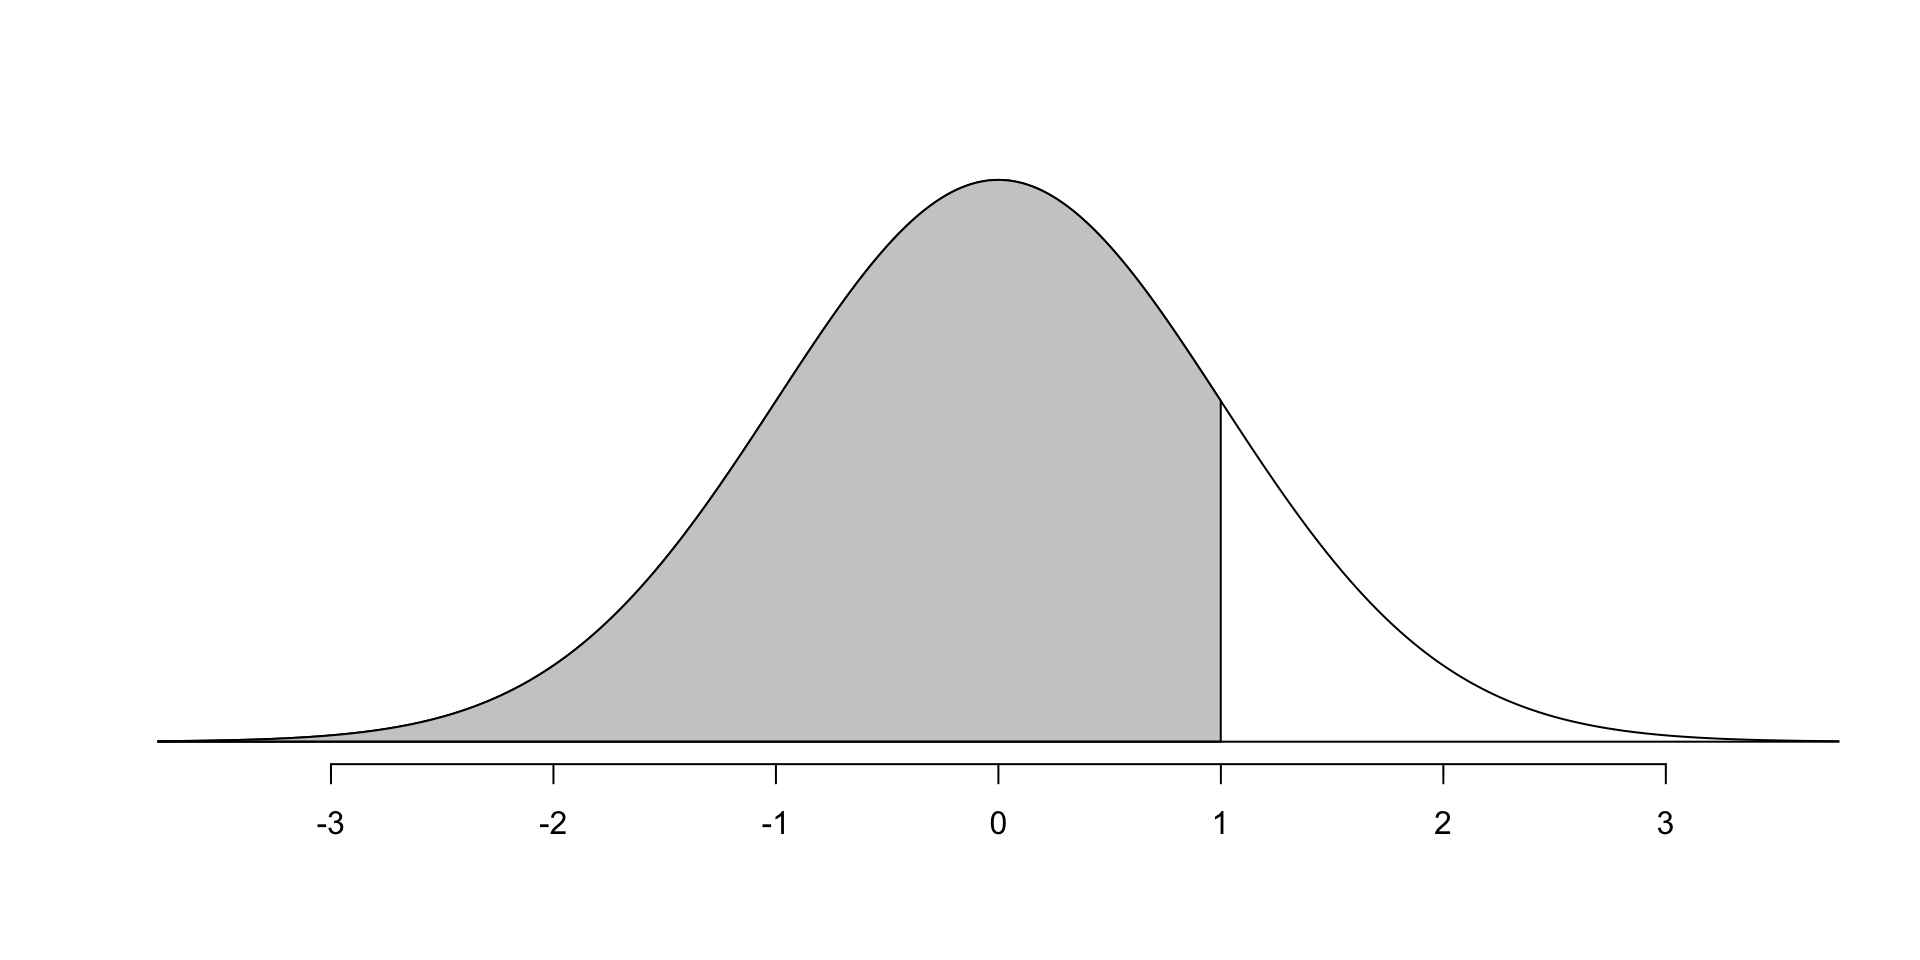
Standard Normal Distribuion
- mean is 0
- standard deviation is 1
- area under curve is 1
Z-scores also tell us about percentiles.
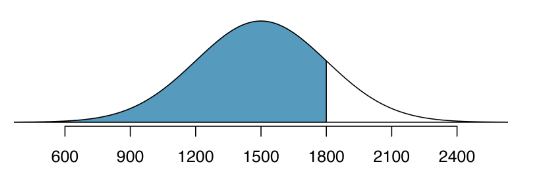
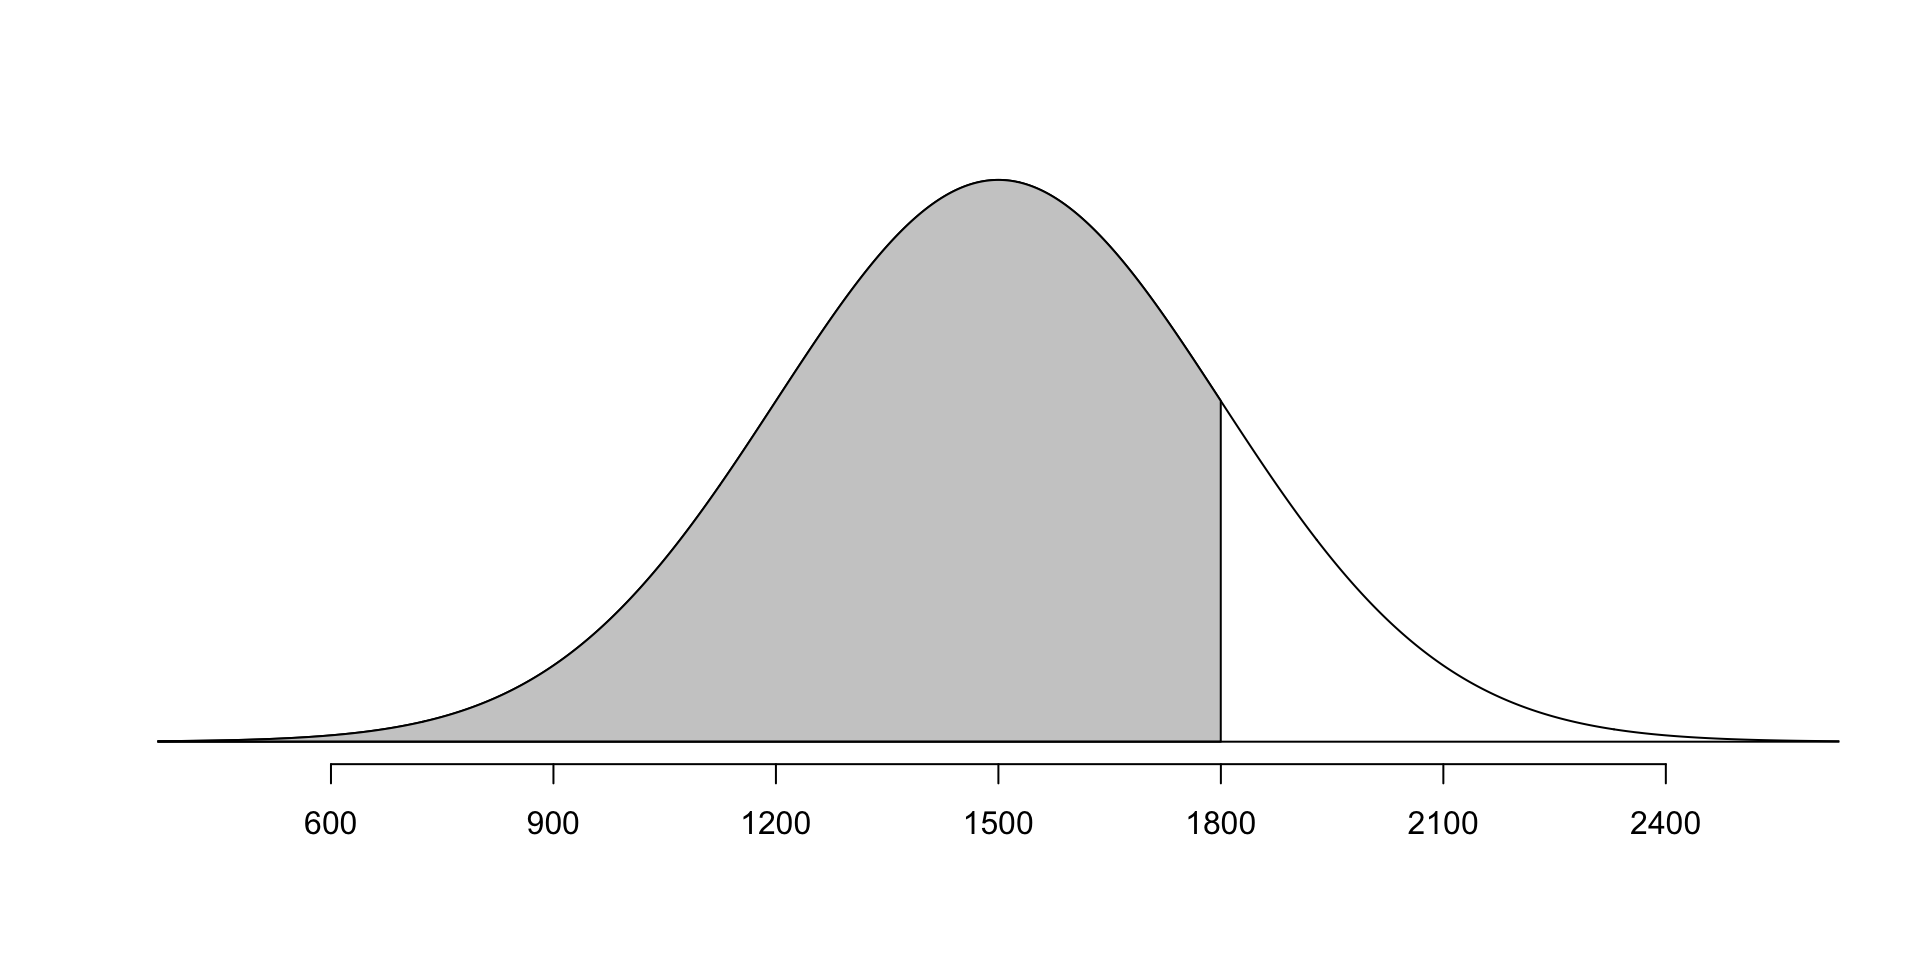
Nel had SAT score 1800 corresponding to \(Z=1\). What percentile are they in?

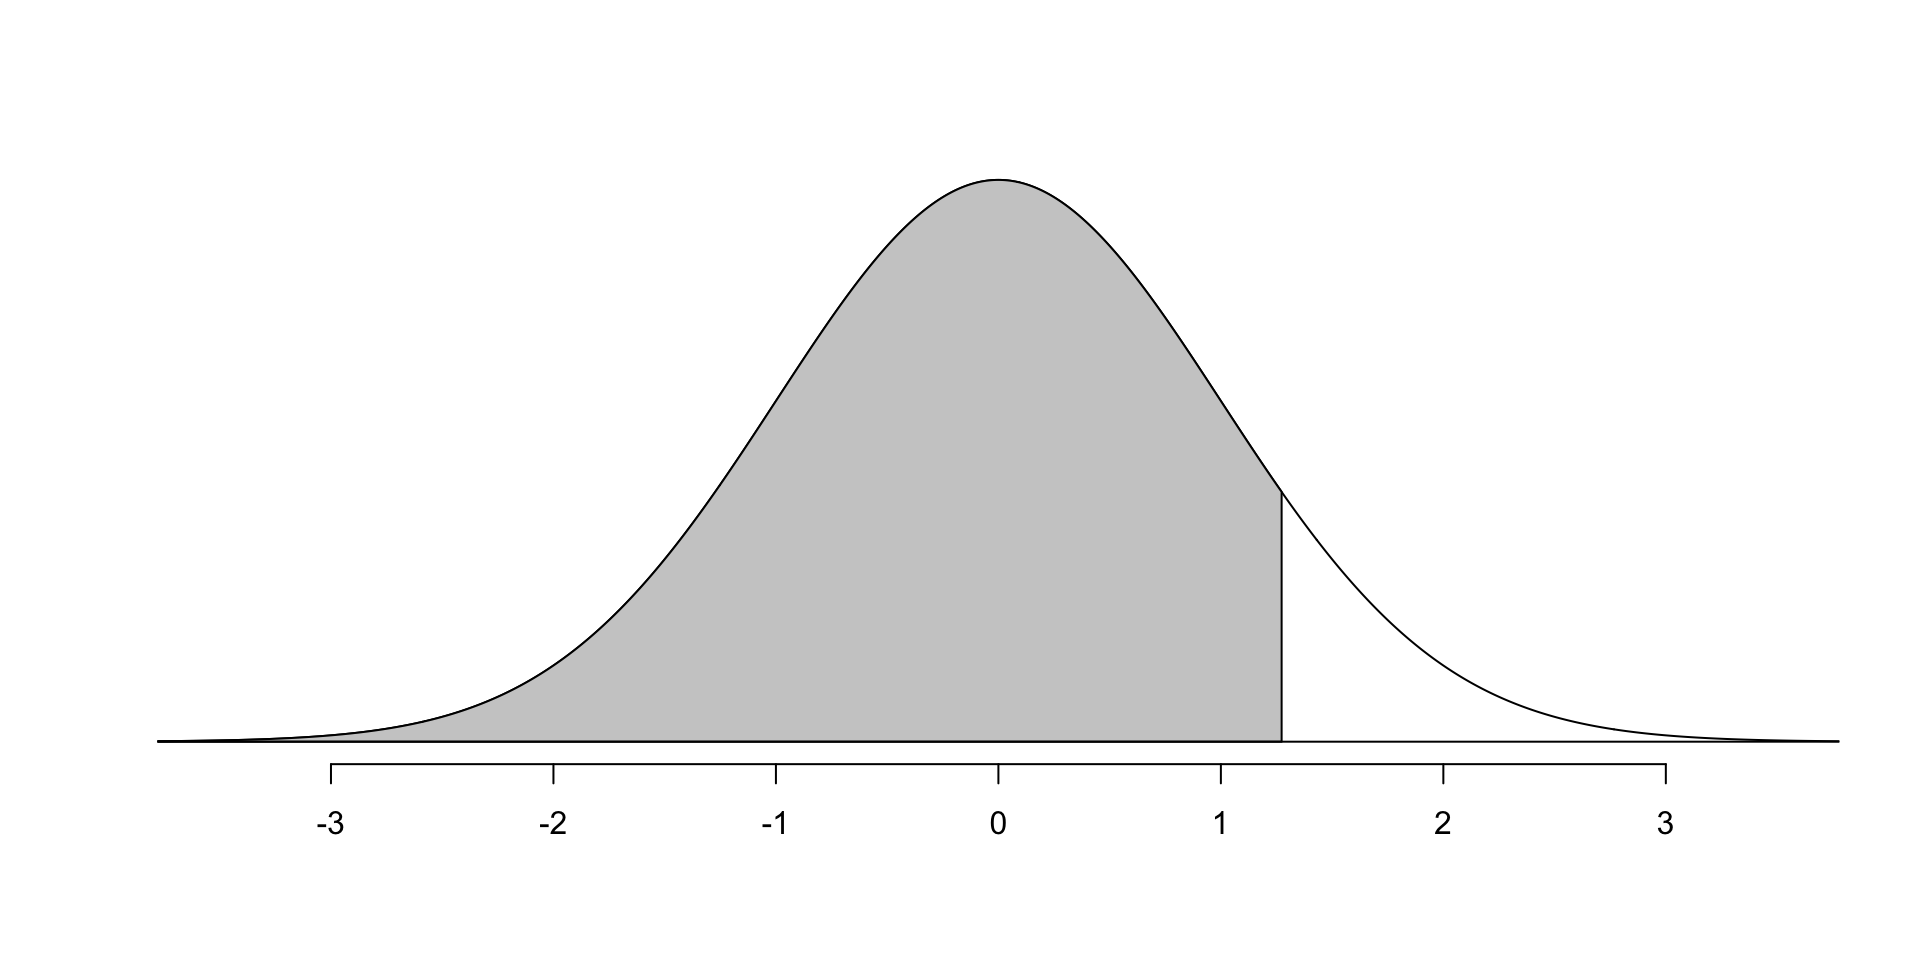
What percentage of scores are less than 1800? Same as shaded area!
Find the shaded area
- Use a table (need z-score)
- Use technology (dont need z-score)
Z-score table
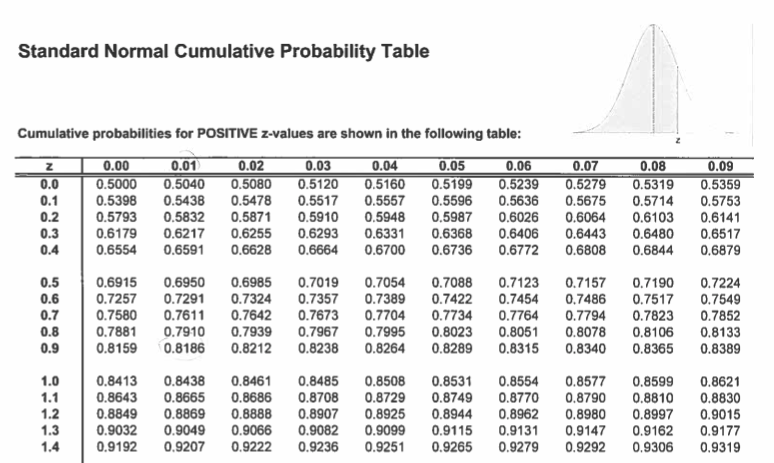
A z-score of 1 corresponds to 84th percentile.
Z-score to percentile with technology
aka Normal Cumulative Probability (CDF)
Technology without Z-score
Percentile to Z-score
What z-score would correspond to 90th percentile?
Percentile to Z-score with table
What z-score would correspond to 90th percentile?