Chapter 11
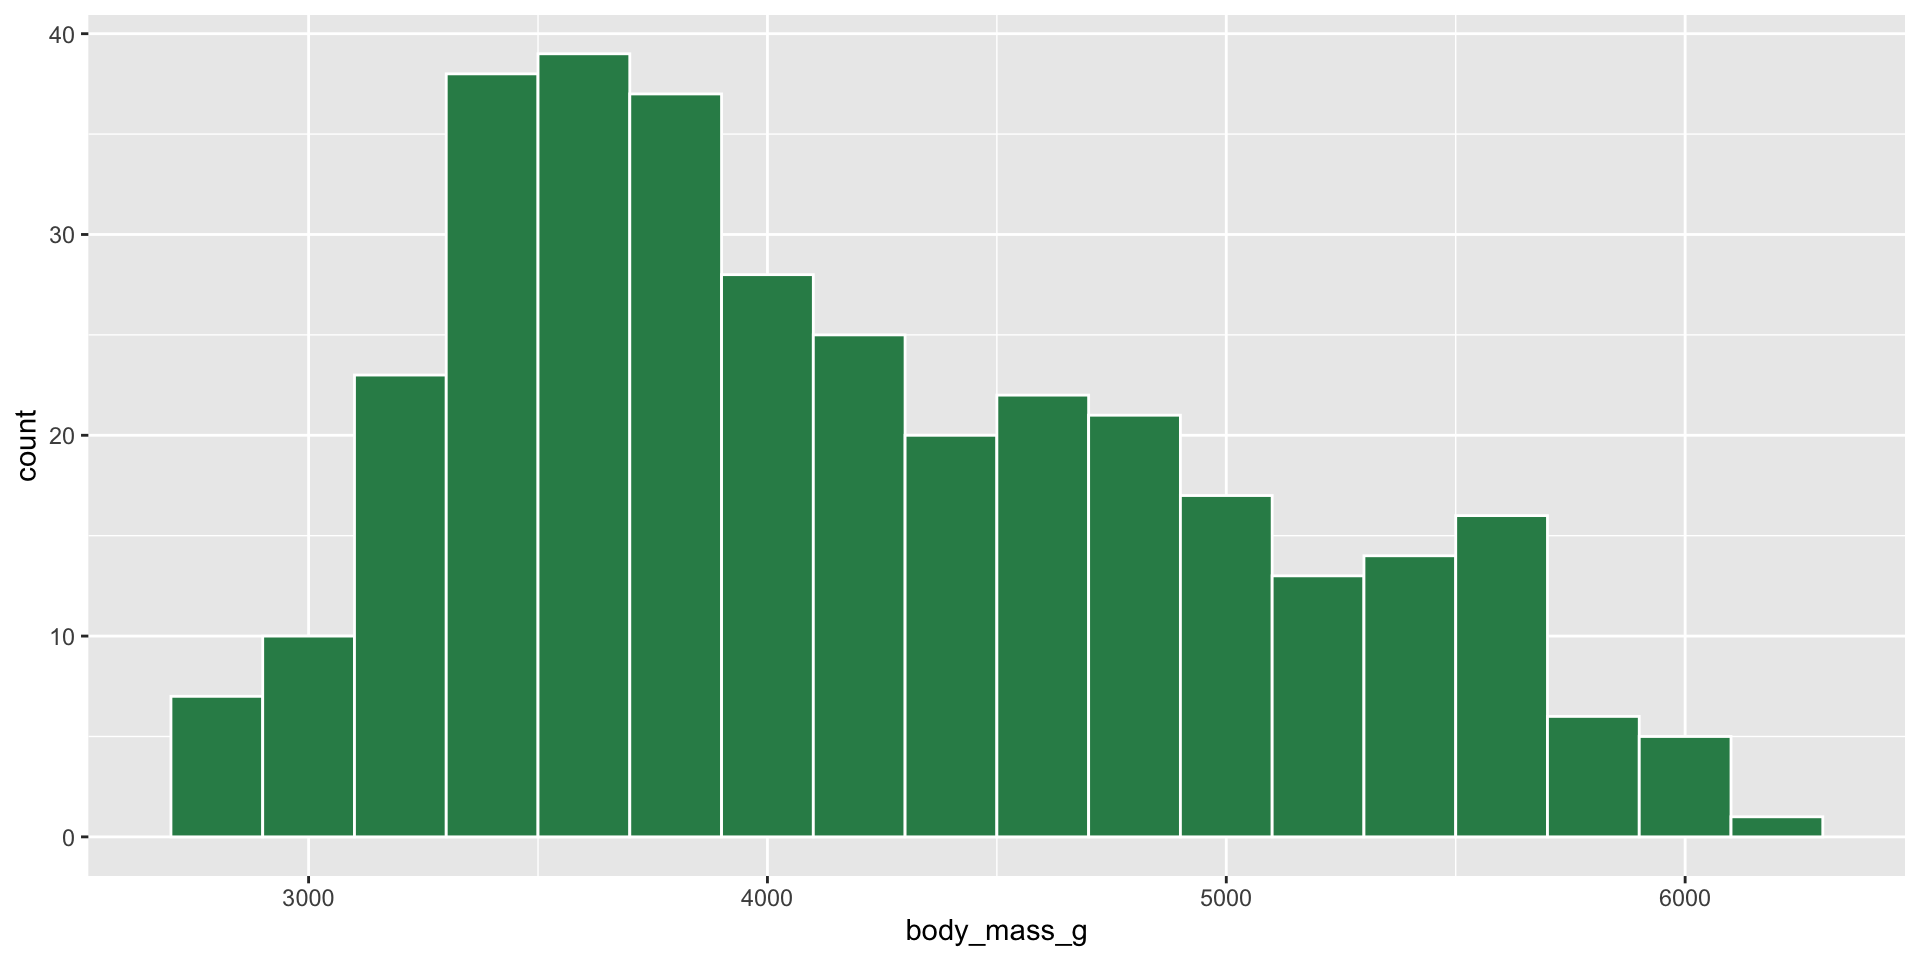
ggplot(penguins, mapping = aes(x = body_mass_g)) +
  geom_histogram(binwidth=200, col="white", fill = "seagreen")
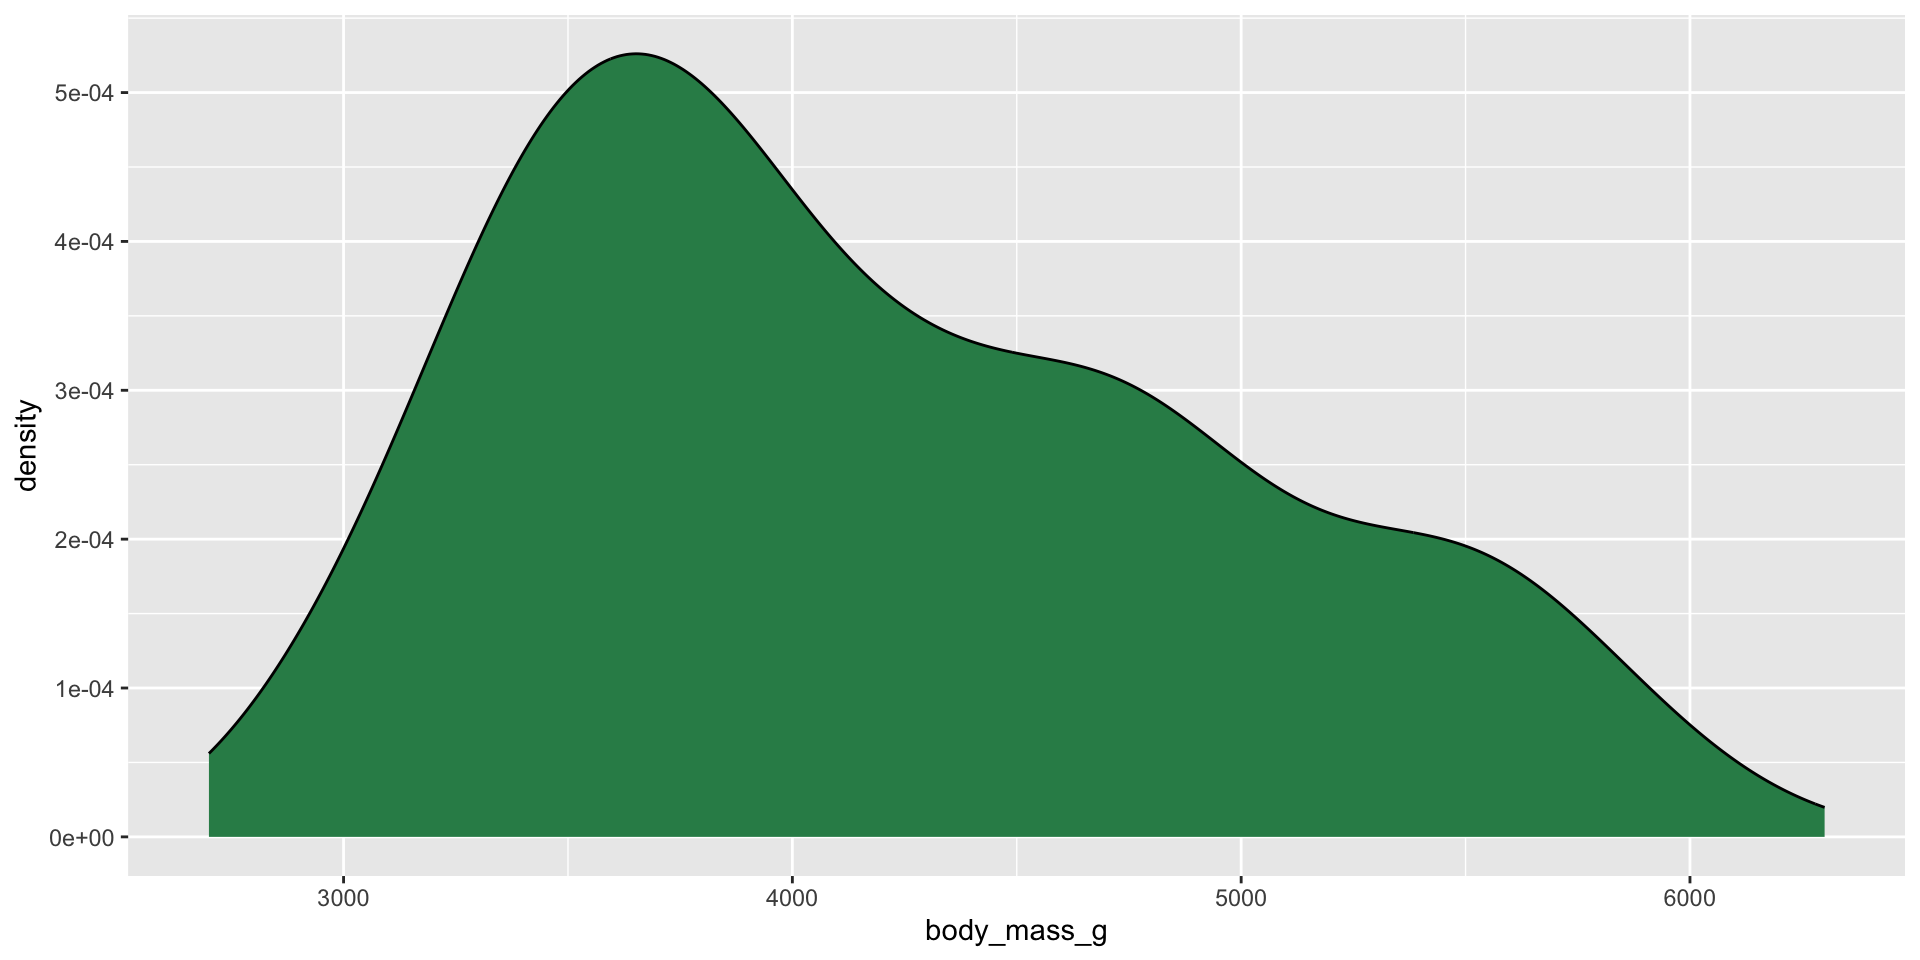
ggplot(penguins, mapping = aes(x = body_mass_g)) +
  geom_density(fill = "seagreen")
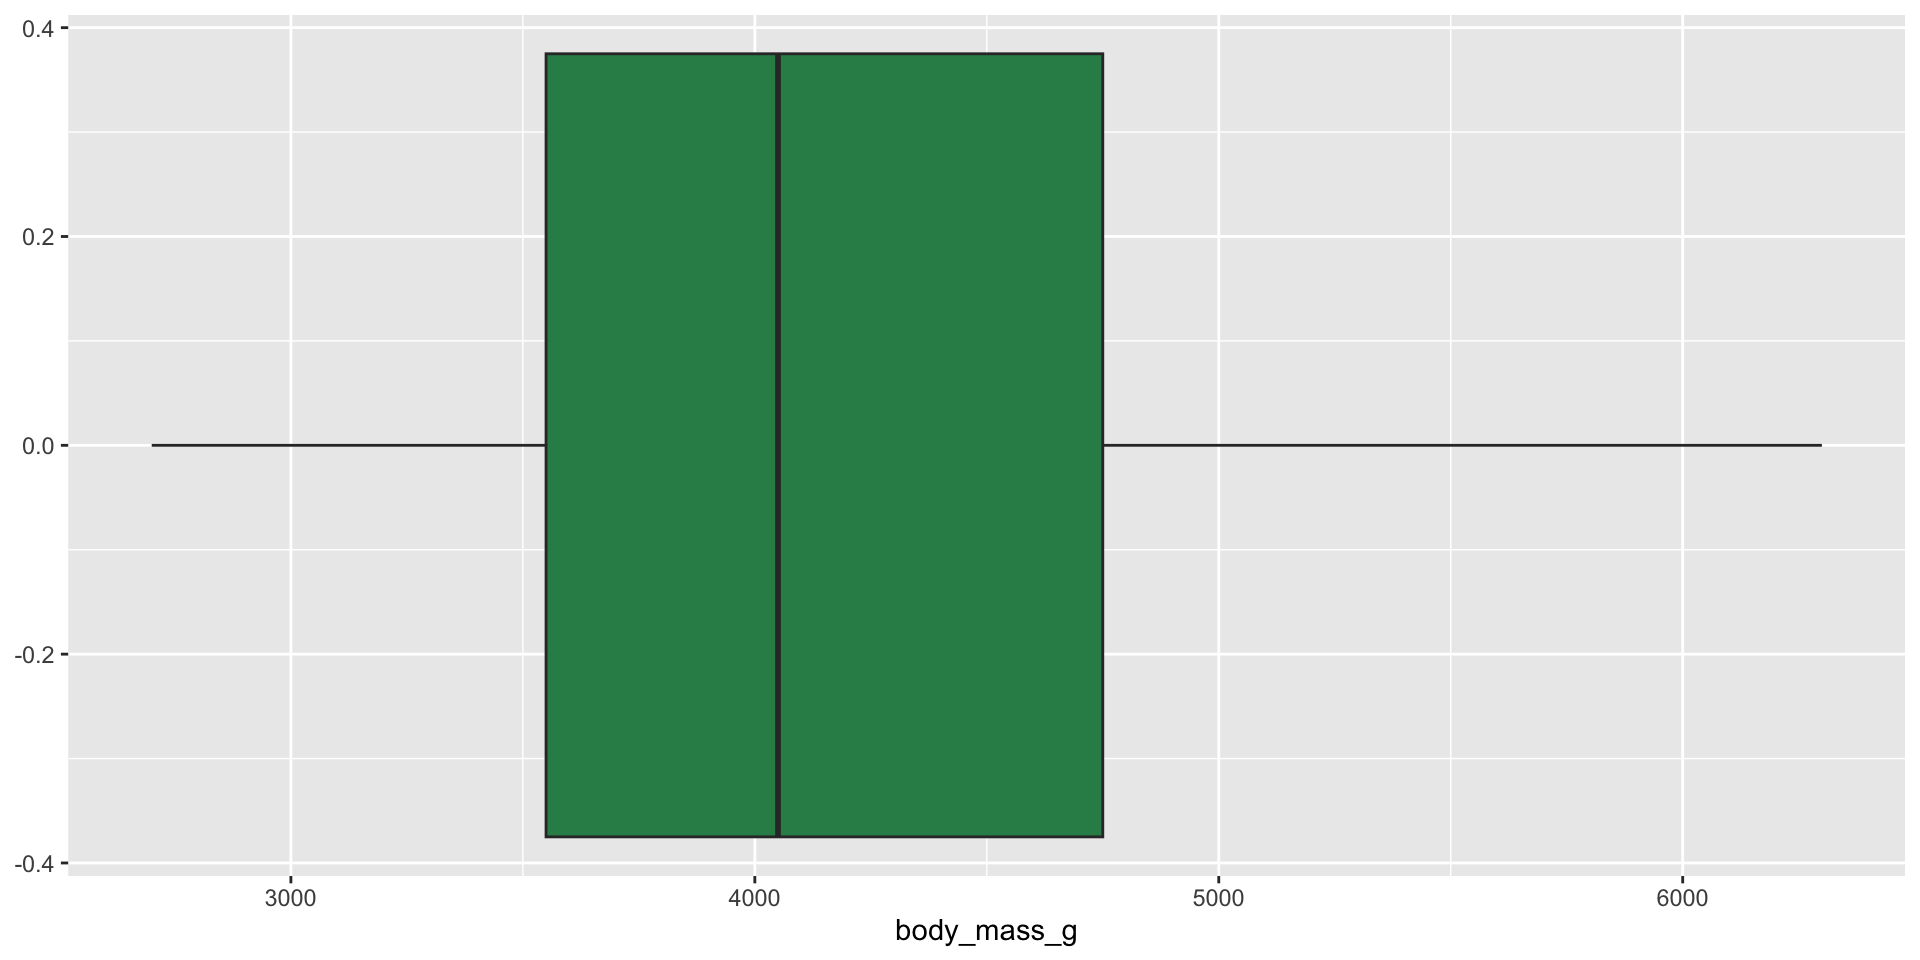
ggplot(penguins, mapping = aes(x = body_mass_g)) +
  geom_boxplot(fill = "seagreen")
species
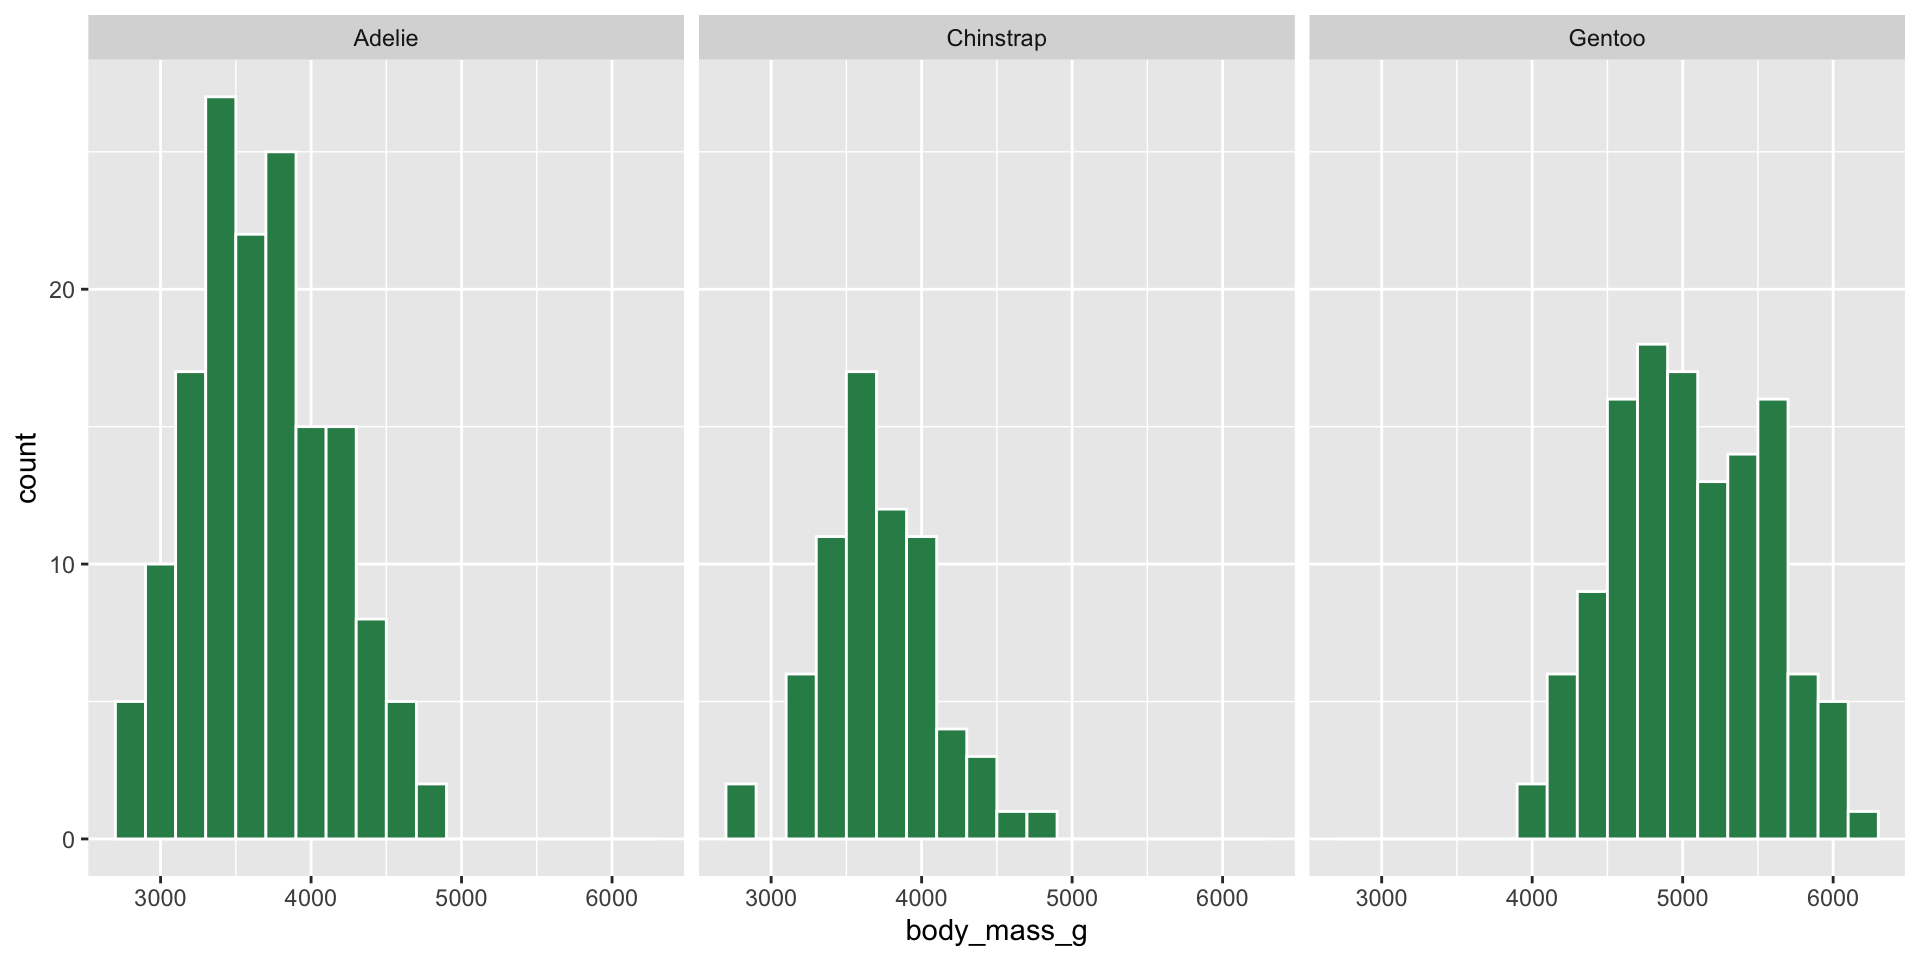
ggplot(penguins, mapping = aes(x = body_mass_g)) +
  geom_histogram(binwidth=200, col="white", fill = "seagreen") +
  facet_wrap(~species)
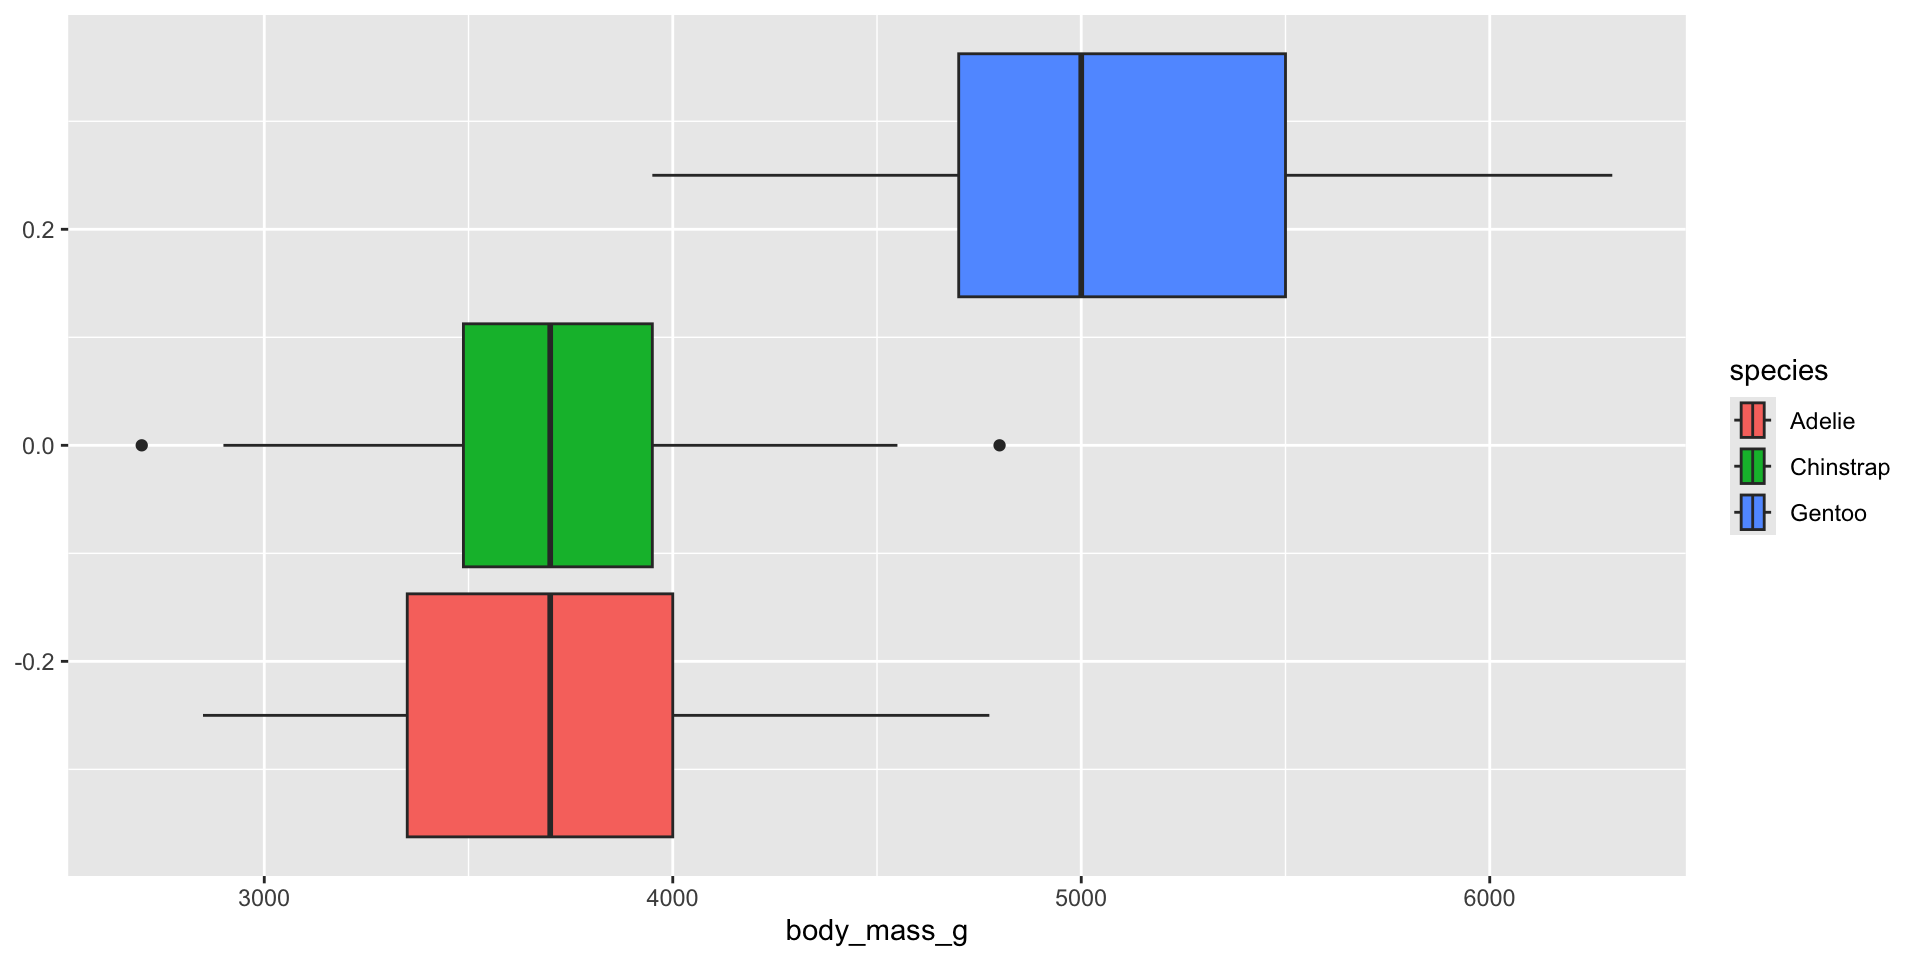
ggplot(penguins, mapping = aes(x = body_mass_g, fill = species)) +
  geom_boxplot()
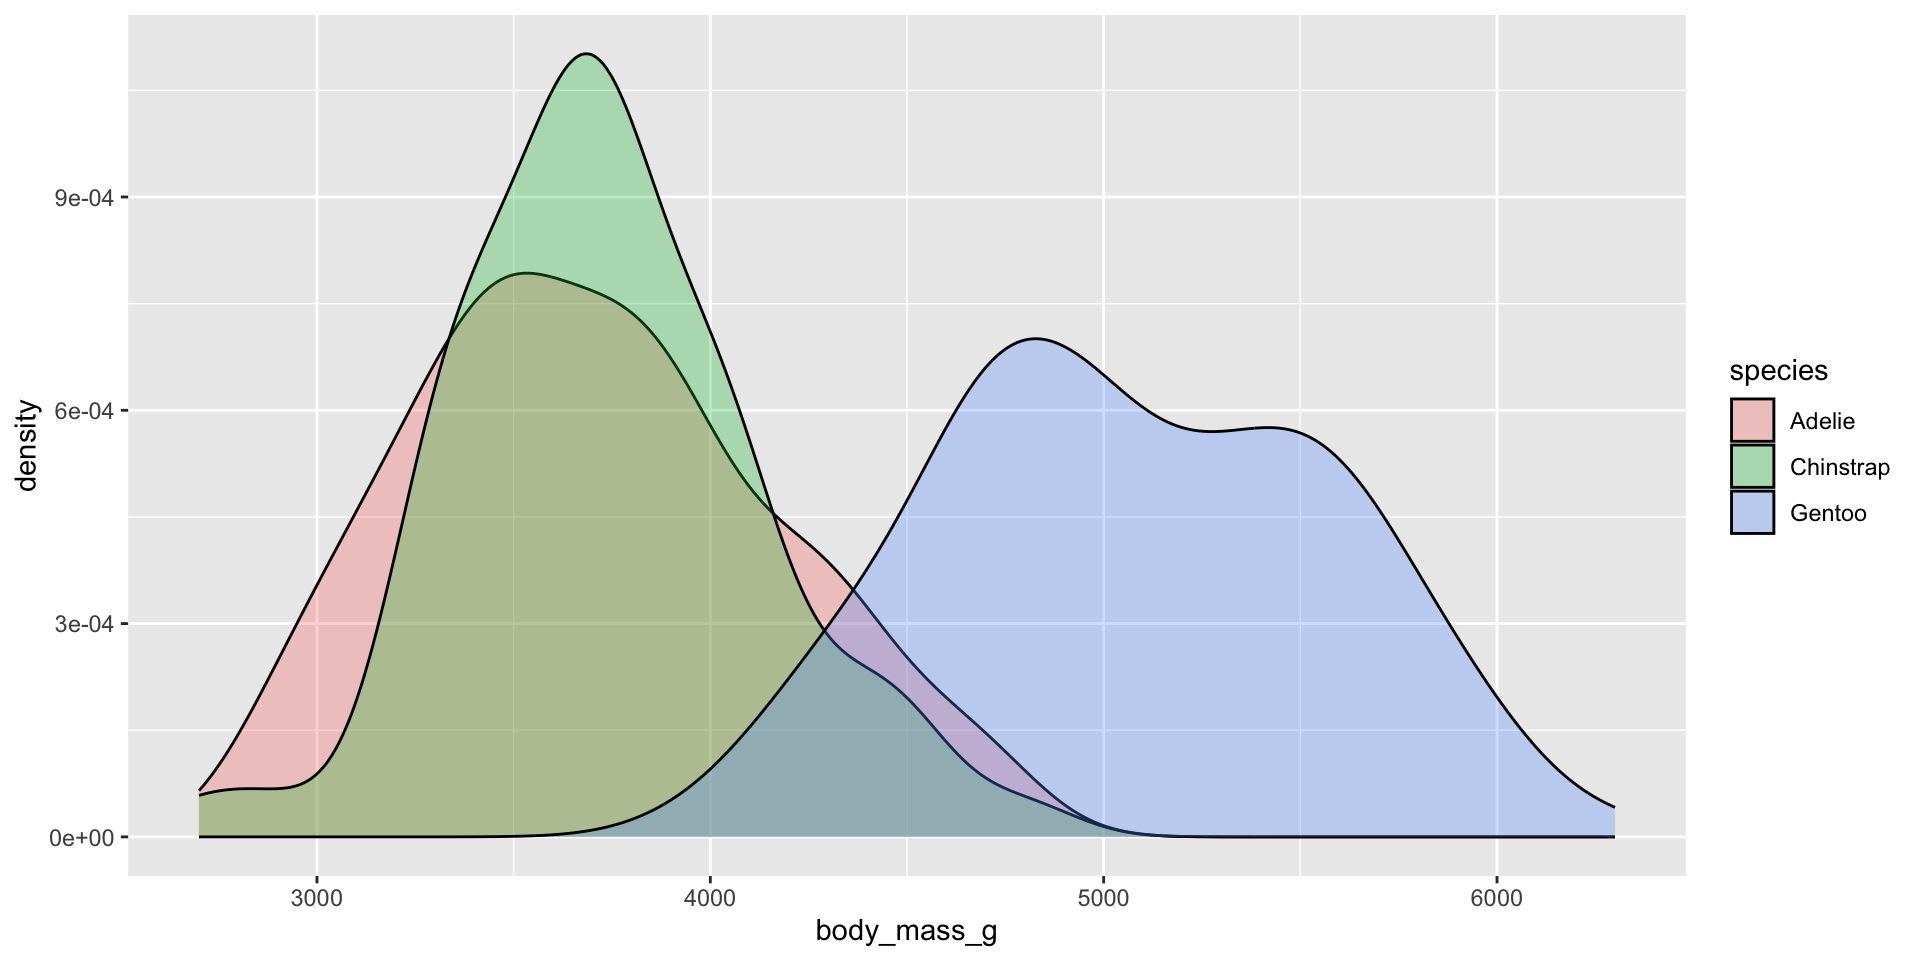
ggplot(penguins, mapping = aes(x = body_mass_g, fill = species)) +
  geom_density(alpha = 0.3)
ggplot(penguins, aes(x = body_mass_g, y = species, fill = species)) +
  geom_density_ridges(alpha = 0.3)
penguins |>
  group_by(species) |>
  summarize( mean = mean(body_mass_g, na.rm = TRUE),
             sd = sd(body_mass_g, na.rm = TRUE)
  )
# A tibble: 3 × 3
  species    mean    sd
  <fct>     <dbl> <dbl>
1 Adelie    3701.  459.
2 Chinstrap 3733.  384.
3 Gentoo    5076.  504.
Question: Are the mean body weights of Adelie and Chinstraps really different? Or is the difference just due to random variation?
Chapter 5: sample mean is (hopefully) an approxmiation of the population mean
Clearly the sample means are different (3701 vs. 3733)
But are the population means different?
Mean body weight of Adelie and Chinstrap penguins are the same.
Mean body weight of Adelie and Chinstrap penguins are different.
If you flip a fair coin 100 times, how many times will it come up heads?
Do a simulation
Textbook Section 11.1