Linear Regression, Cont.
Chapter 7
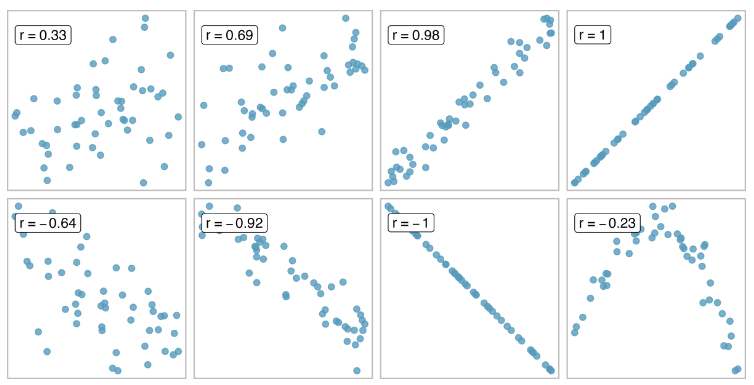
Correlation Coefficient
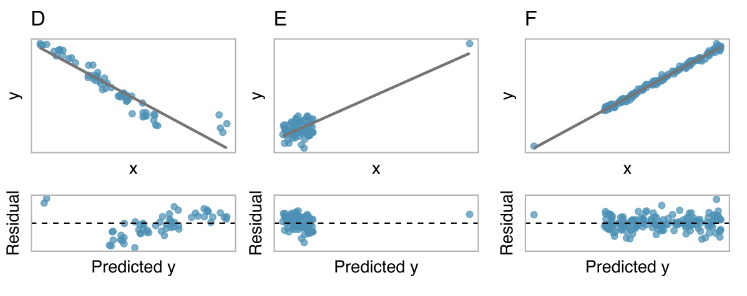
Linear Regression
\[ \hat{y} = b_0 + b_1 \cdot \hat{x} \]
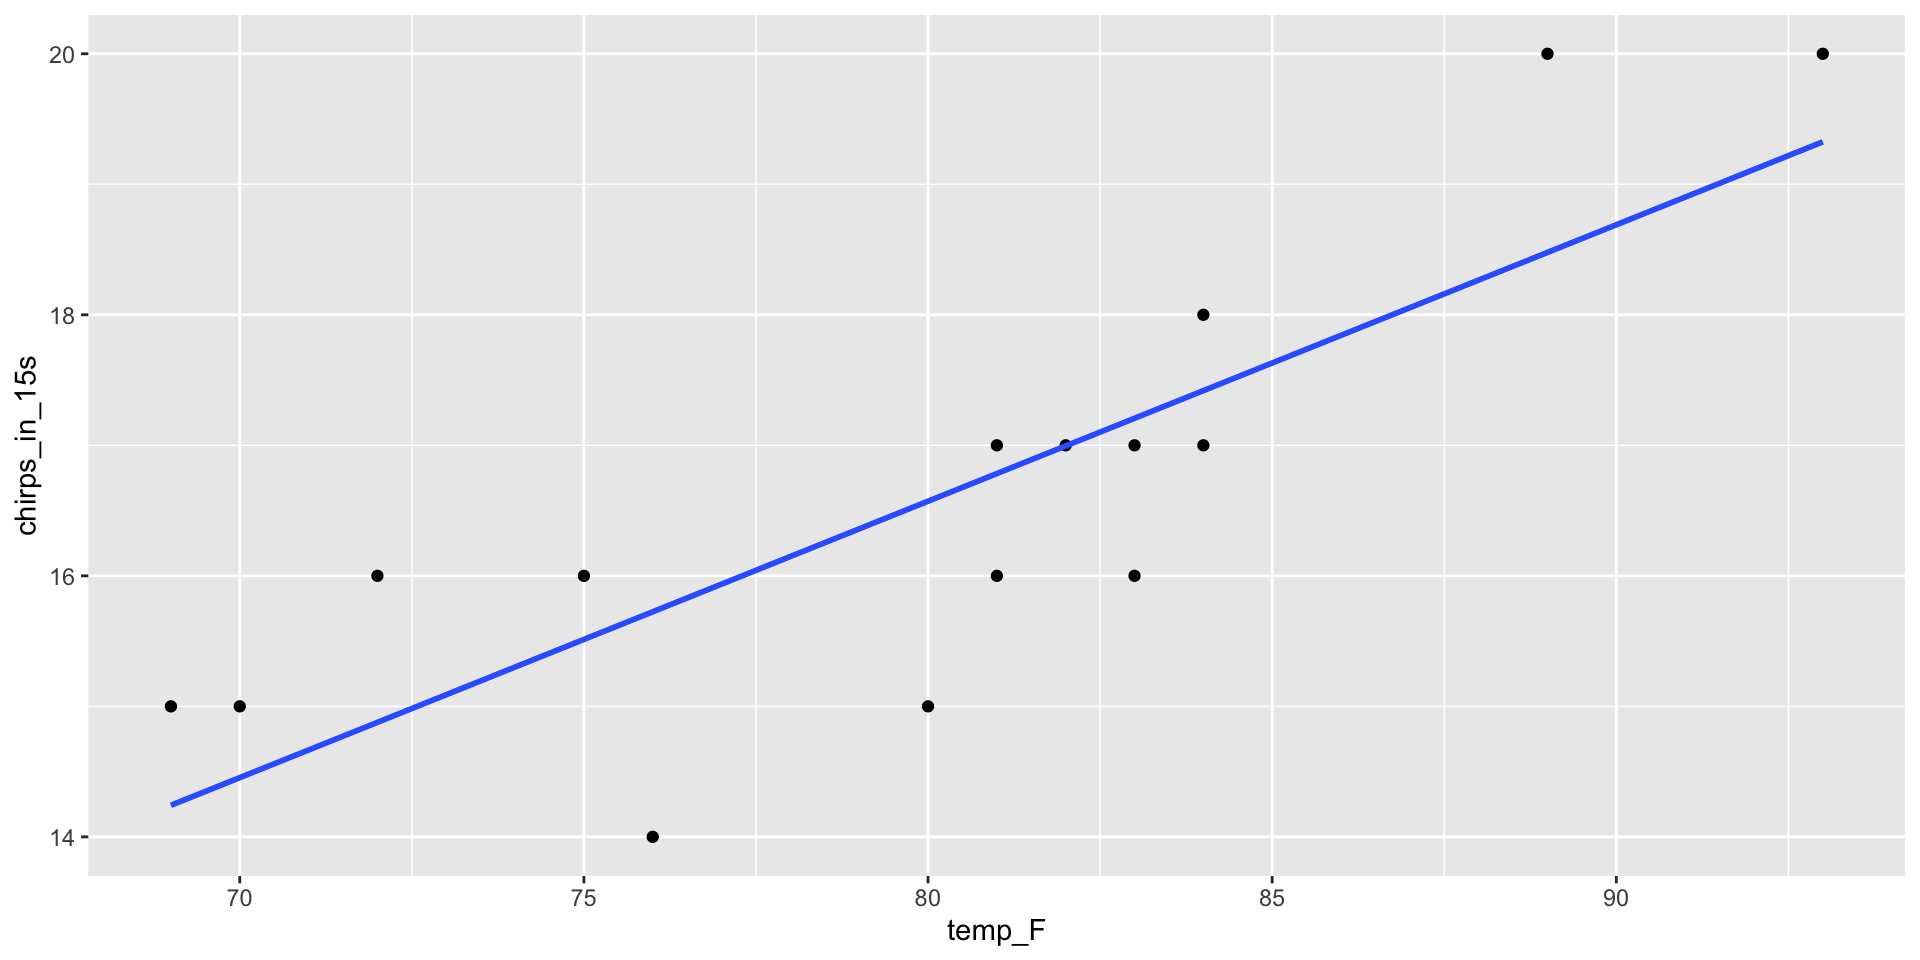
Don’t Extrapolate!!
\[ \hat{y} = -0.372 + 0.212 \, \hat{x} \]
What do you expect the chirp rate will be if temperature is 100?

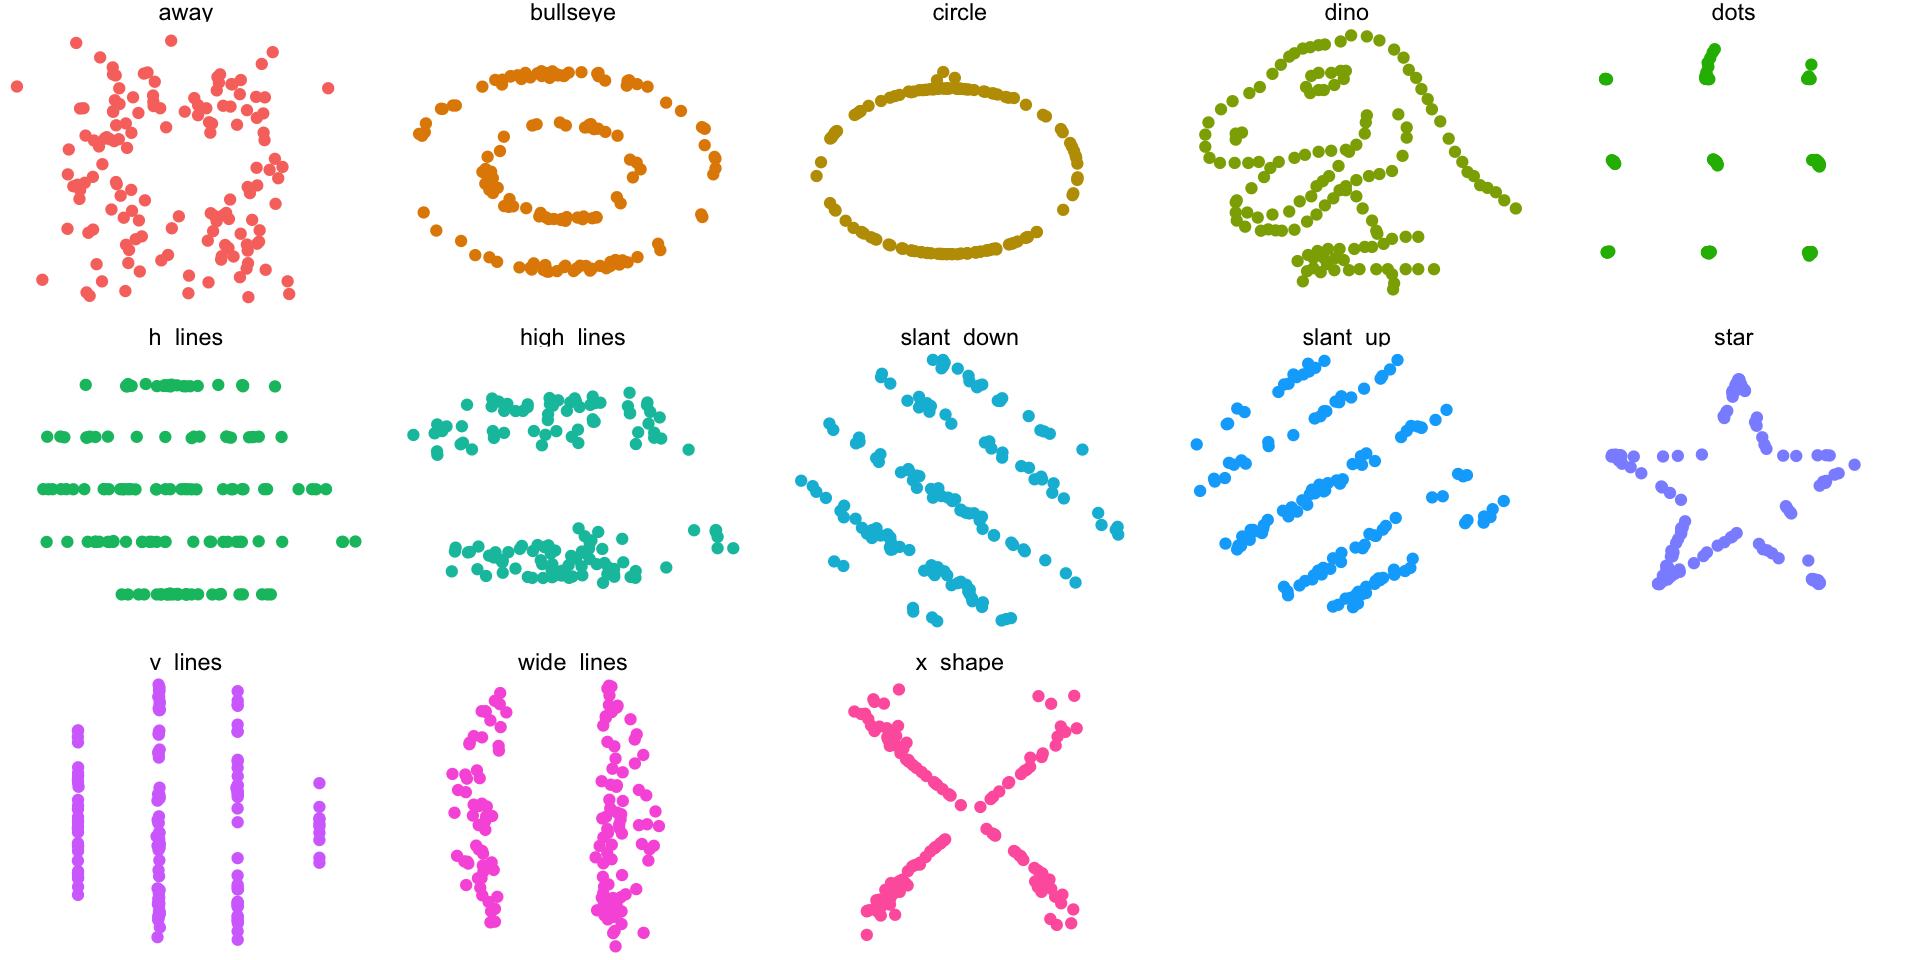
Outliers
Each data set has at least one outlier. How do the outliers affect the slope of the regression line?