Linear Regression
Chp 7
In groups
- Discuss Homework: 7.5 #1, 3, 7, 9, 19
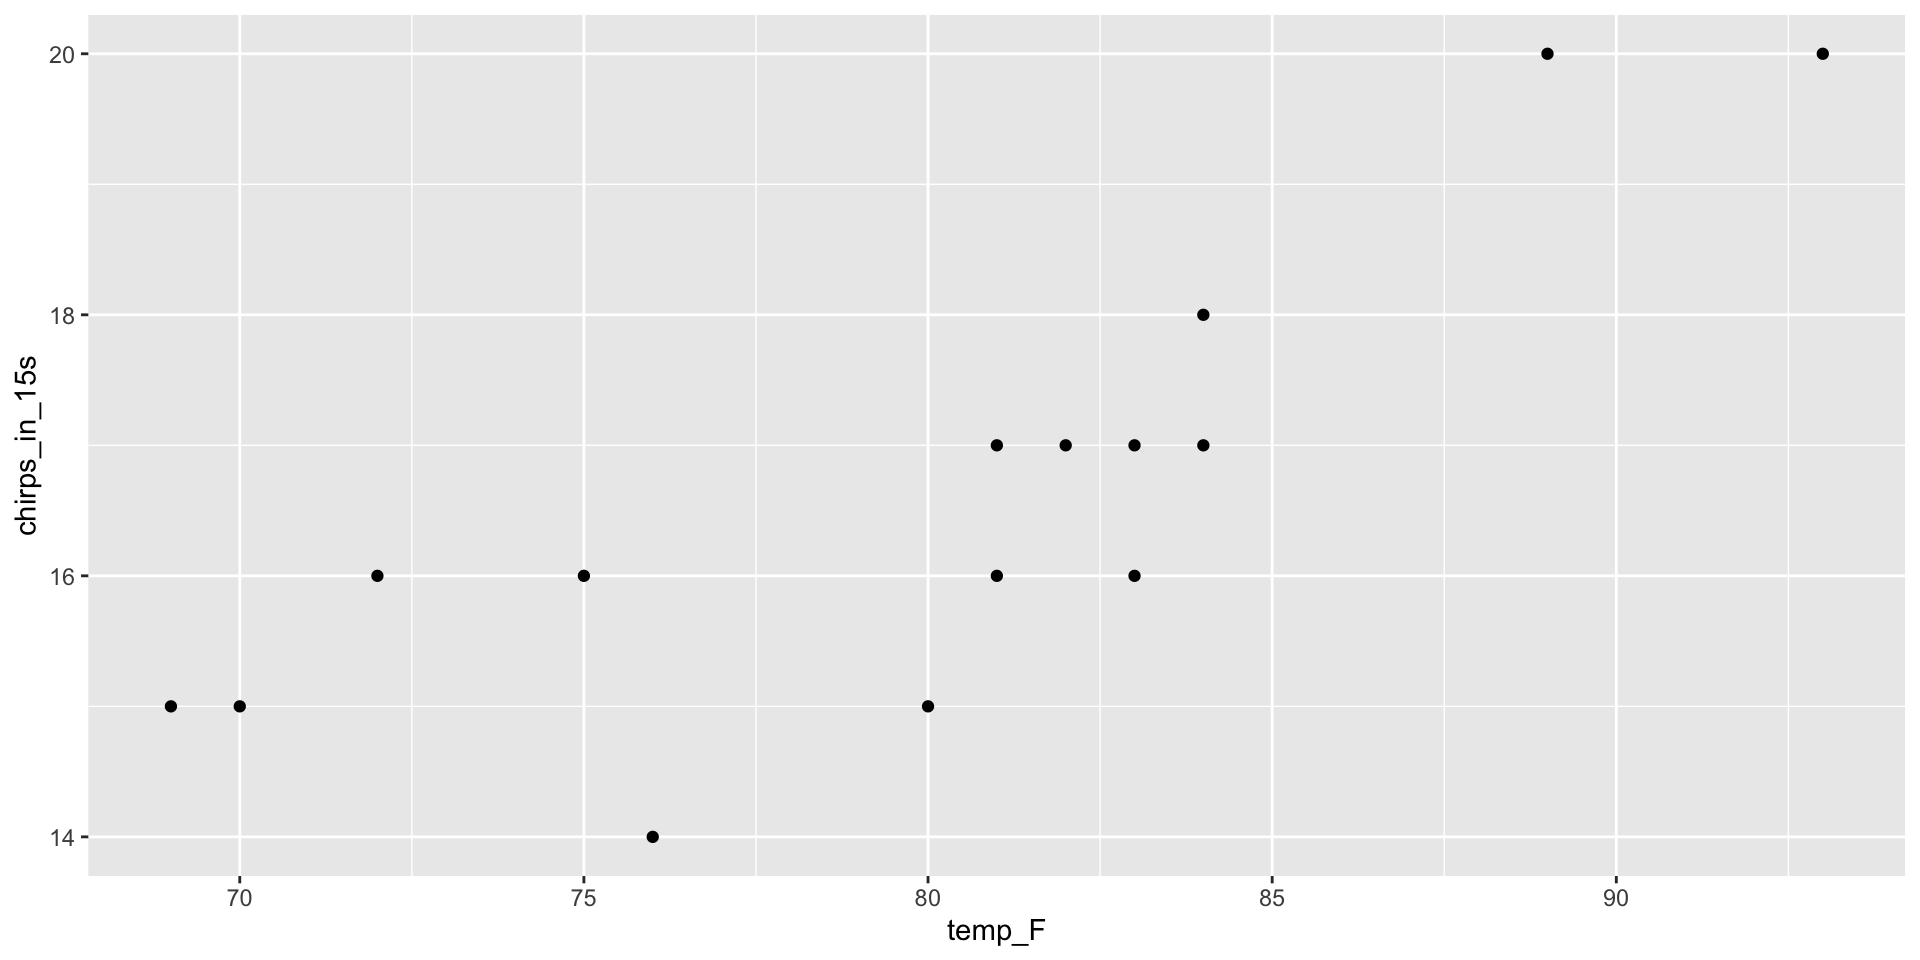
Cricket Chirps and Temperature
Do cricket chirp rates and air temperature seem to be associated?
Linear Regression
Best fit line
Linear model
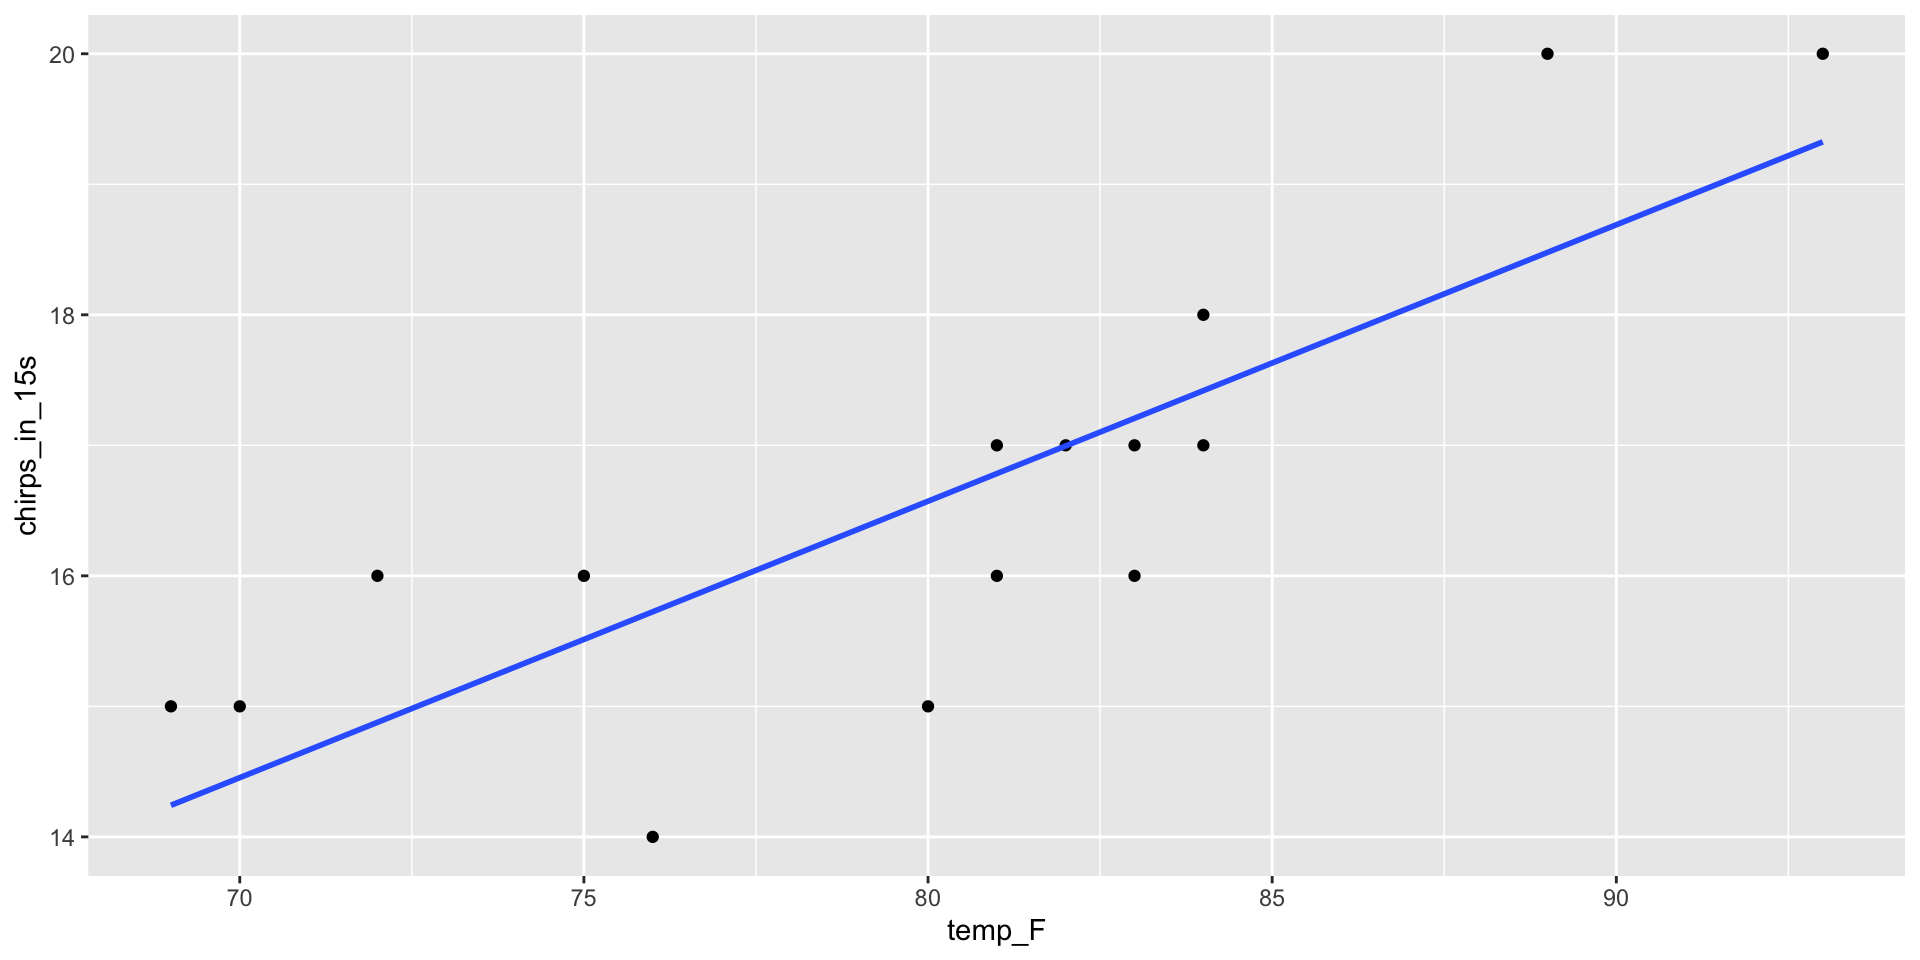
Finding the regression line
Recall – a line has the equation \[ y = m x + b\] where \(m\) is the slope and \(b\) is the intercept.
\(x\) is the predictor or explanatory or independent variable
\(y\) is the response or outcome or dependent variable. In prediction problems, this is what we are interested in predicting.
Residuals
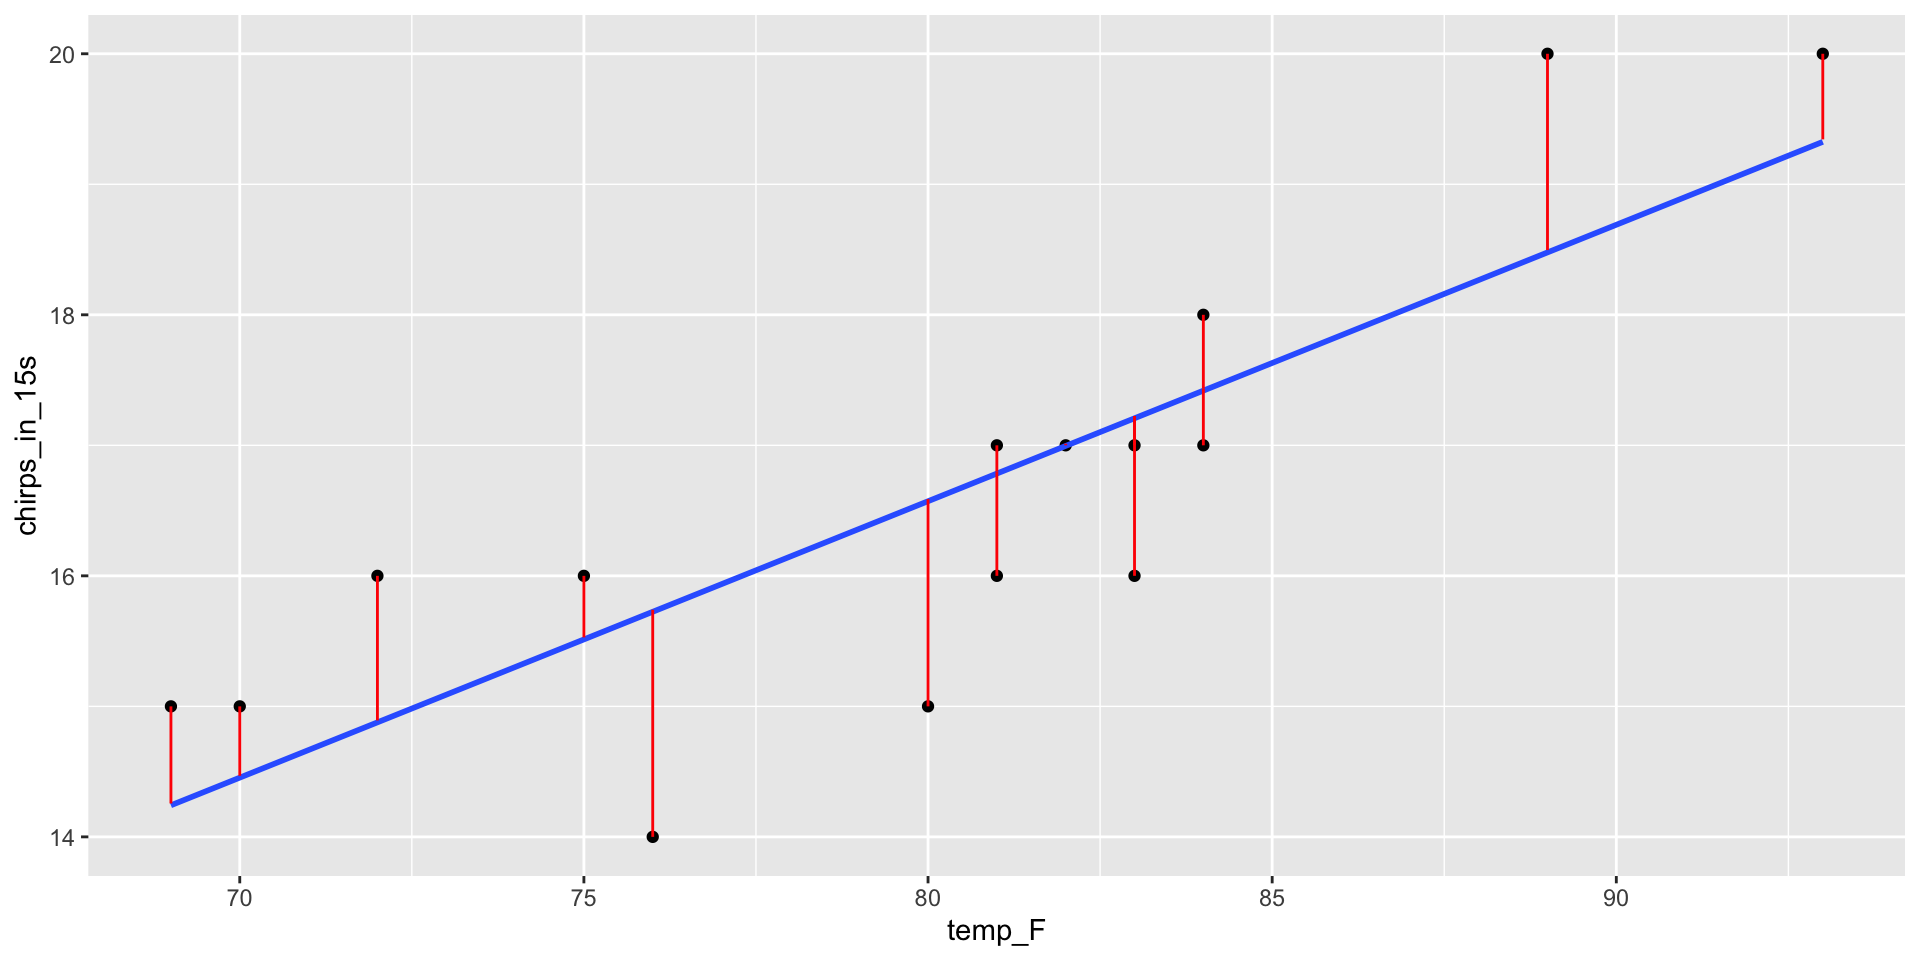
least squares regression line
\[ \hat{y} = b_0 + b_1 \cdot \hat{x} \]
- Minimizes (sum of squared) distance between data points and line
- Residuals balance out above and below line
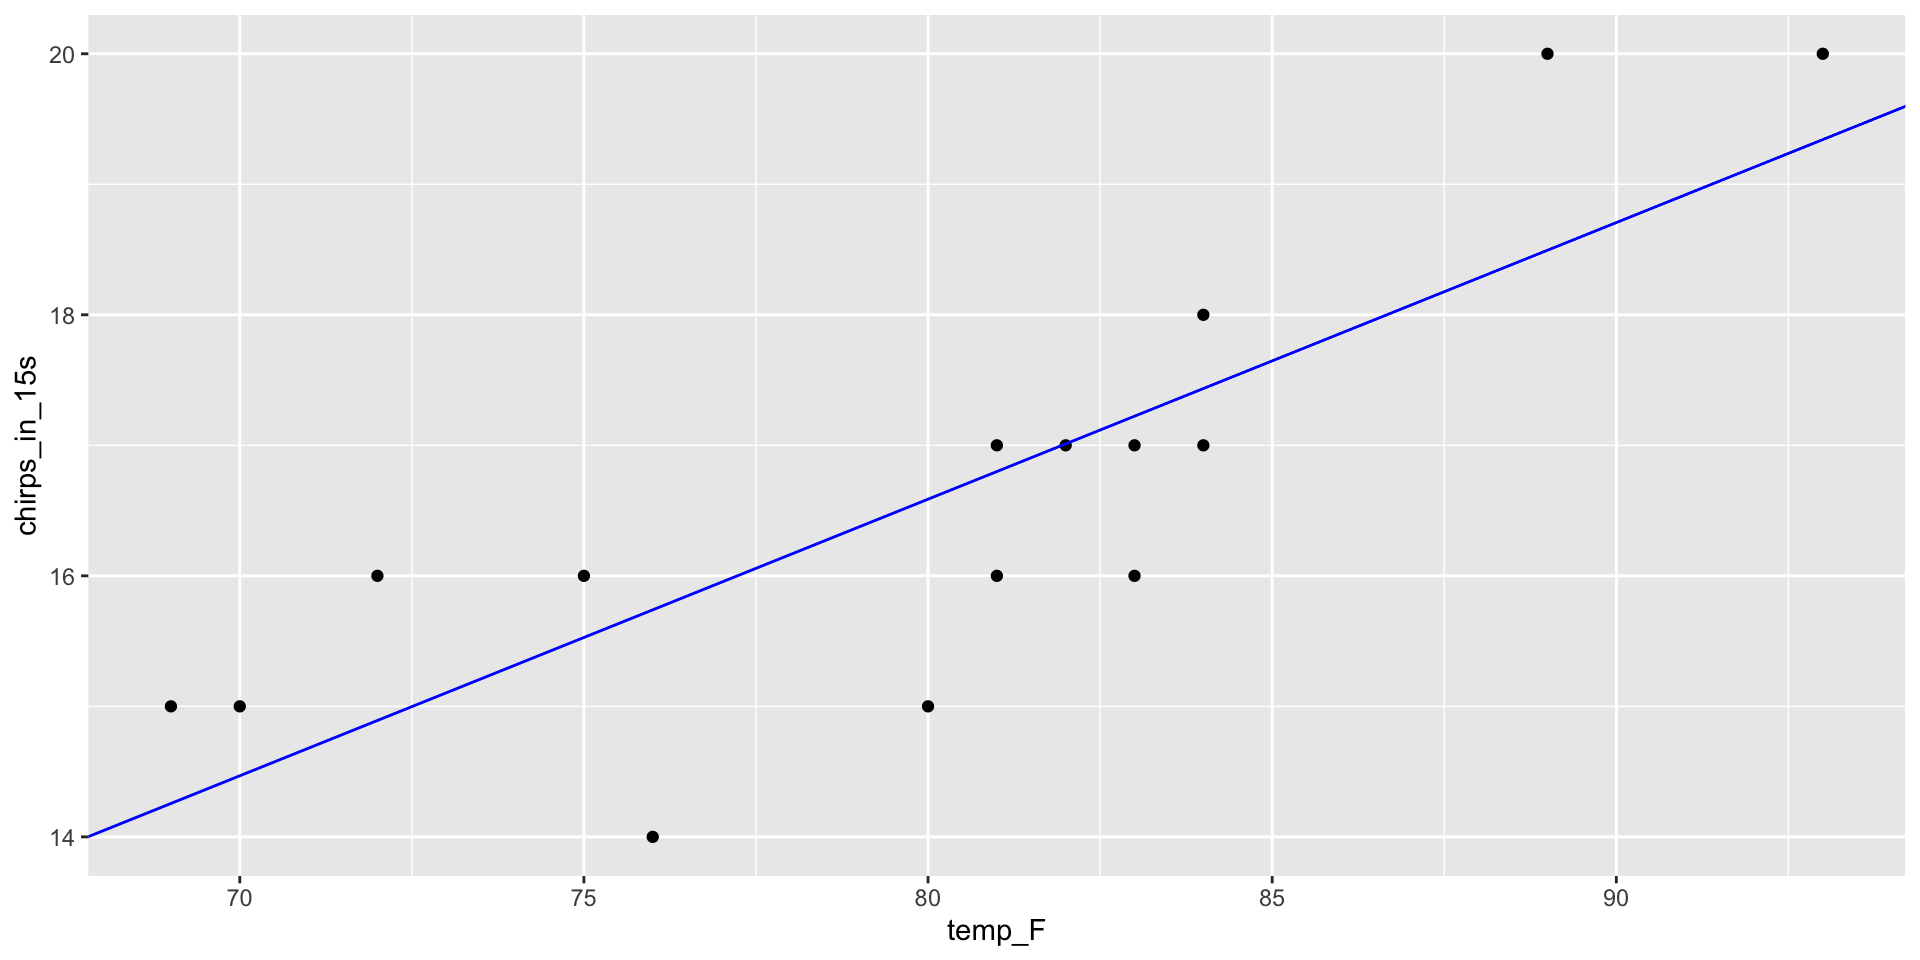
- The point \((\bar{x}, \bar{y})\) always lies on line (though it’s not necessarily a data point!)
Correlation coefficient, r
Also called the Pearson Product-Moment Correlation, here’s how r is calculated:
\[ r = \frac{1}{n-1}\sum_{i=1}^n \frac{ x_i - \bar{x}}{s_x} \frac{y_i - \bar{y}}{s_y} \] We’ll have R do this for us!
Correlation coefficient, r
Finding the regression line
\[ \hat{y} = b_0 + b_1 \cdot \hat{x} \] First we find the slope: \[b_1 = r \left( \frac{s_y}{s_x} \right)\]
In this formula:
- \(r\) = correlation coefficient
- \(s_y\) = standard deviation of \(y\)
- \(s_x\) = standard deviation of \(x\)
Finding the regression line
\[ \hat{y} = b_0 + b_1 \cdot \hat{x} \] Next we use the fact that \((\bar{x}, \bar{y})\) is on the line. Plug these values into line equation
\[\bar{y} = b_0 + b_1 \cdot \bar{x} \] Now everything is known except \(b_0\) so we can solve for that!
\[ b_0 = \bar{y} - b_1 \bar{x} \]
Calculuate!
Linear Model
\[ \hat{y} = 0.212 \hat{x} - 0.372 \]
Next Steps
- What can we do with our linear model (i.e. regression line)?
- What is the significance of correlation coefficient \(r\)?